

Question: epare horizontal analysis. 2), AP E13-3 Here is financial information for Glitter Inc. December 31, 2016 $ 90,000 350,000 65,000 90,000 115,000 170,000 December 31,
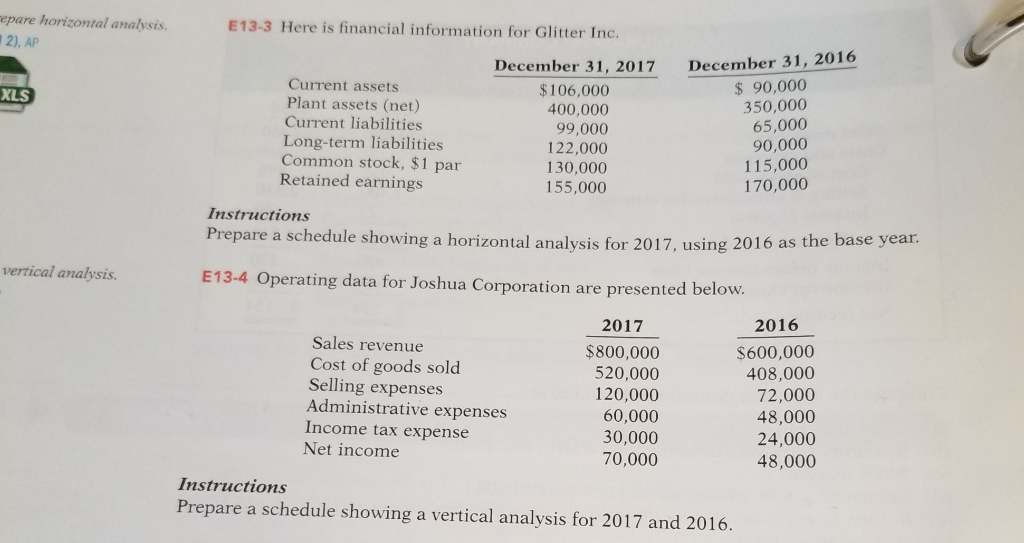
epare horizontal analysis. 2), AP E13-3 Here is financial information for Glitter Inc. December 31, 2016 $ 90,000 350,000 65,000 90,000 115,000 170,000 December 31, 2017 $106,000 400,000 99,000 122,000 130,000 155,000 Current assets Plant assets (net) Current liabilities Long-term liabilities Common stock, $1 par Retained earnings XLS Instructions Prepare a schedule showing a horizontal analysis for 2017, using 2016 as the base year vertical analysis. E13-4 Operating data for Joshua Corporation are presented below. 2017 $800,000 520,000 120,000 60,000 30,000 70,000 2016 Sales revenue Cost of goods sold Selling expenses Administrative expenses Income tax expense Net income $600,000 408,000 72,000 48,000 24,000 48,000 Instructions Prepare a schedule showing a vertical analysis for 2017 and 2016
Step by Step Solution
There are 3 Steps involved in it

Get step-by-step solutions from verified subject matter experts