

Question: Equity and Liabilities side FINANCIAL STATEMENT ANALYSIS Michael Scott has asked you to analyze Dunder Mifflin Paper Company, Inc.'s Financial Statements, below, by calculating and
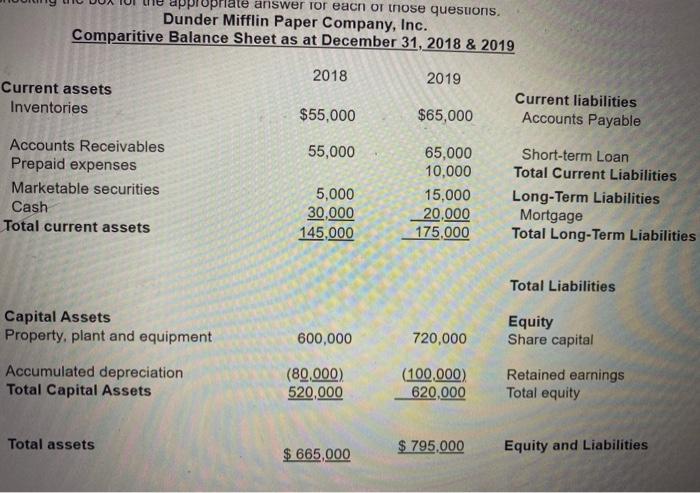
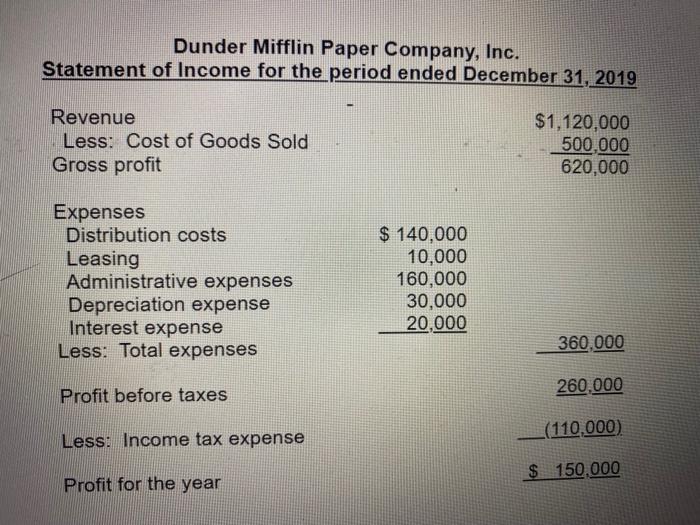
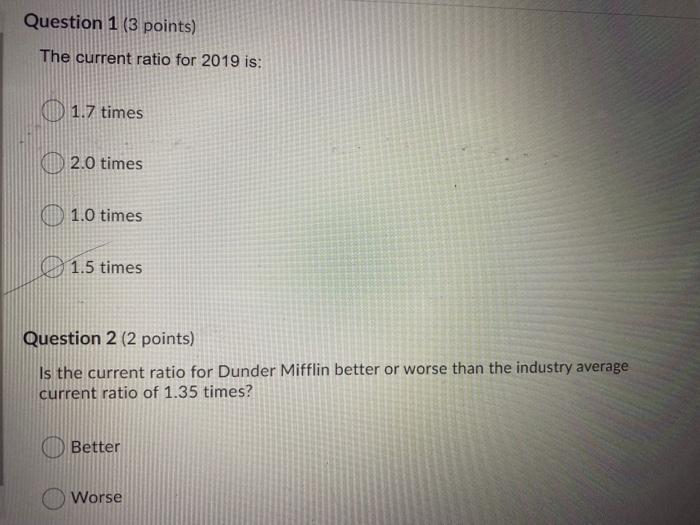
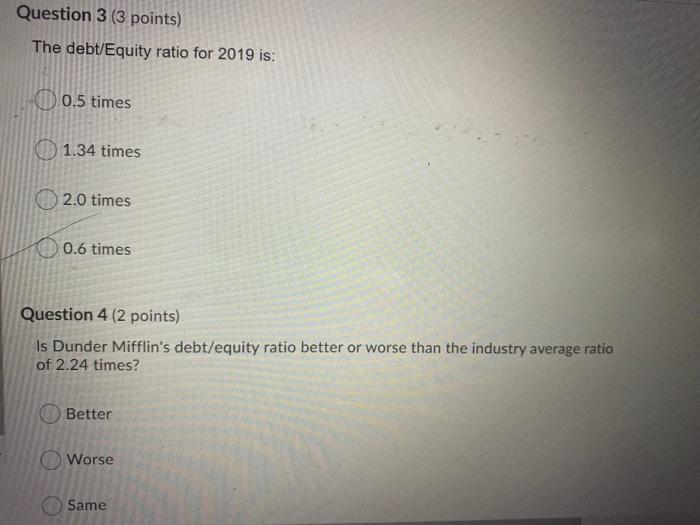
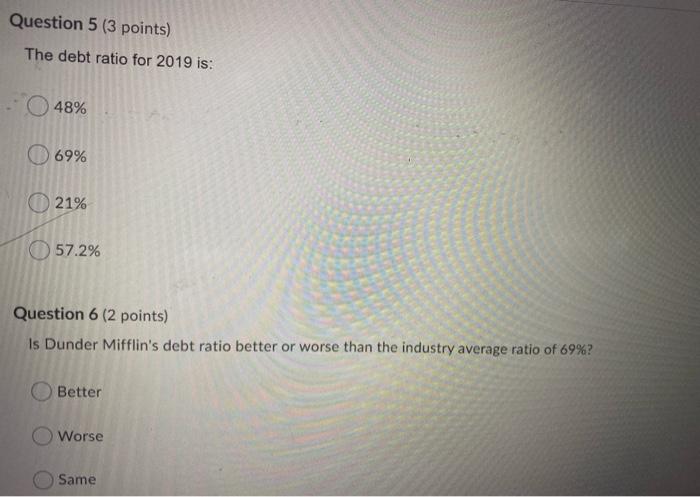
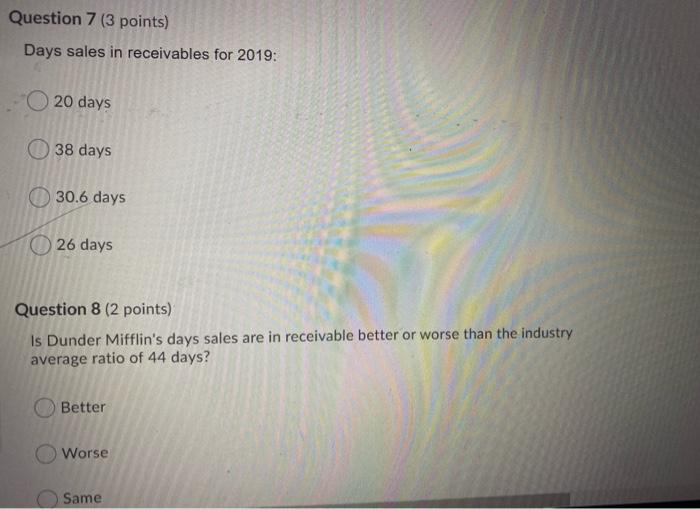
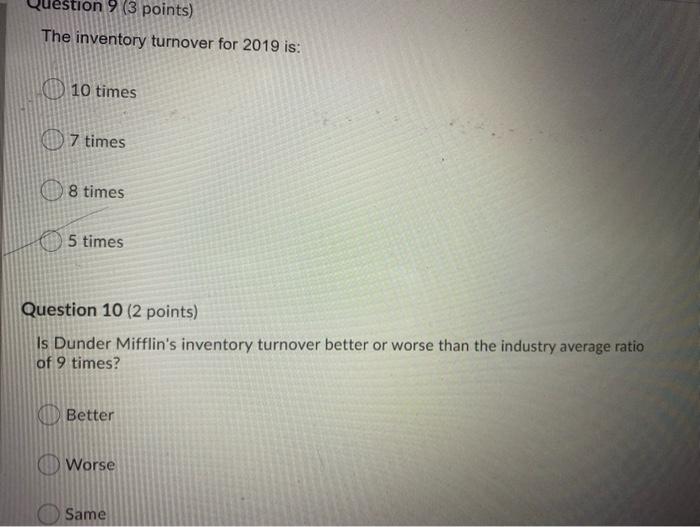
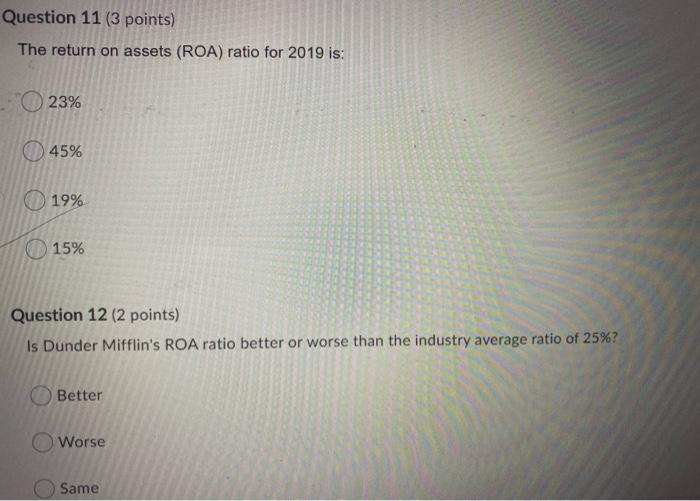
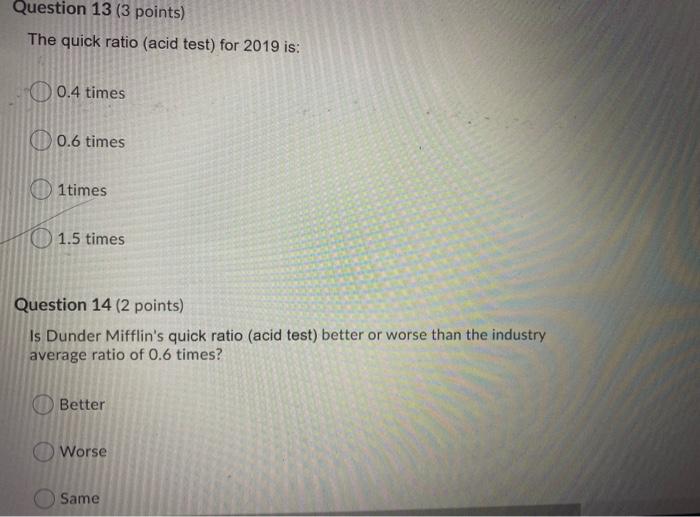
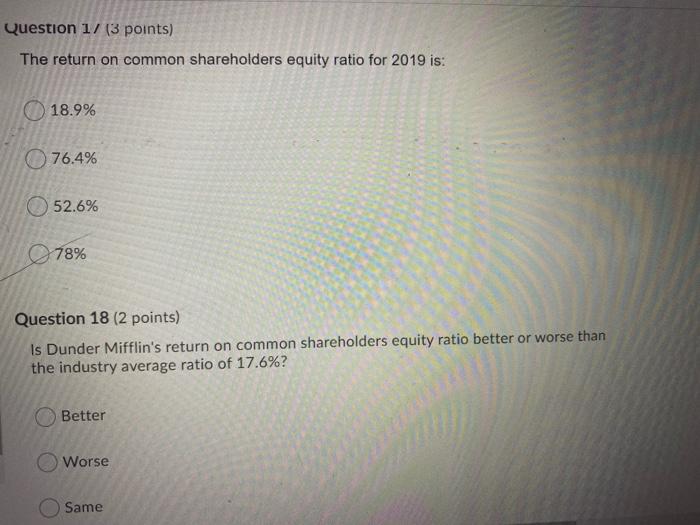
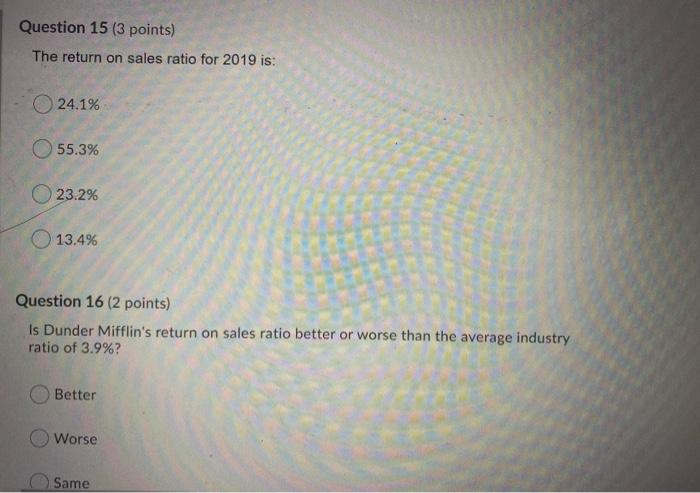
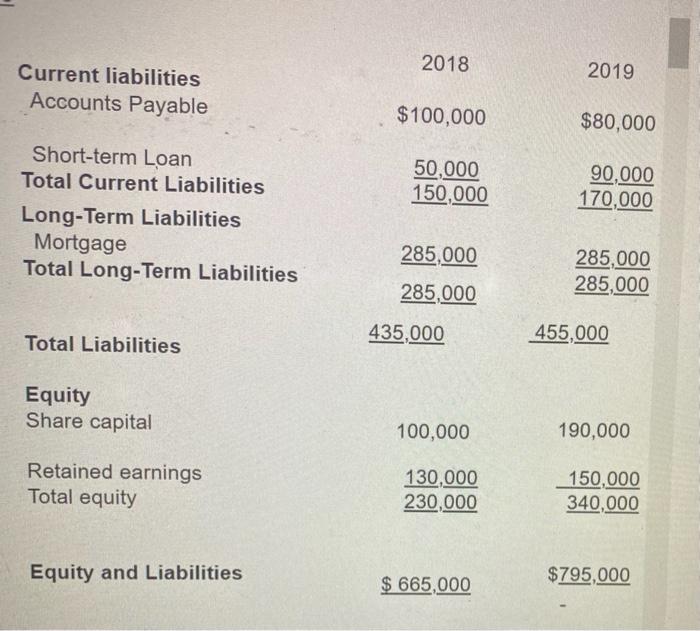
FINANCIAL STATEMENT ANALYSIS Michael Scott has asked you to analyze Dunder Mifflin Paper Company, Inc.'s Financial Statements, below, by calculating and comparing common ratios. Select the correct answer for each ratio question and then indicate whether each ratio for Dunder Mifflin is better or worse than the industry ratios provided, by checking the box for the appropriate answer for each of those questions. ale answer for each of those quesuons. Dunder Mifflin Paper Company, Inc. Comparitive Balance Sheet as at December 31, 2018 & 2019 2018 2019 Current assets Inventories $55,000 $65,000 Current liabilities Accounts Payable 55,000 Accounts Receivables Prepaid expenses Marketable securities Cash Total current assets 5,000 30,000 145,000 65,000 10,000 15,000 20,000 175.000 Short-term Loan Total Current Liabilities Long-Term Liabilities Mortgage Total Long-Term Liabilities Total Liabilities Capital Assets Property, plant and equipment 600,000 720,000 Equity Share capital Accumulated depreciation Total Capital Assets (80,000) 520,000 (100,000) 620.000 Retained earnings Total equity Total assets $ 795,000 $ 665,000 Equity and Liabilities Dunder Mifflin Paper Company, Inc. Statement of Income for the period ended December 31, 2019 Revenue Less: Cost of Goods Sold Gross profit $1,120,000 500,000 620,000 Expenses Distribution costs Leasing Administrative expenses Depreciation expense Interest expense Less: Total expenses $ 140,000 10,000 160,000 30.000 20,000 360,000 Profit before taxes 260.000 (110,000) Less: Income tax expense $ 150.000 Profit for the year Question 1 (3 points) The current ratio for 2019 is: 1.7 times 2.0 times 1.0 times 1.5 times Question 2 (2 points) Is the current ratio for Dunder Mifflin better or worse than the industry average current ratio of 1.35 times? Better Worse Question 3 (3 points) The debt/Equity ratio for 2019 is: 0.5 times 1.34 times 2.0 times 0.6 times Question 4 (2 points) Is Dunder Mifflin's debt/equity ratio better or worse than the industry average ratio of 2.24 times? Better Worse Same Question 5 (3 points) The debt ratio for 2019 is: 48% 69% 21% 57.2% Question 6 (2 points) Is Dunder Mifflin's debt ratio better or worse than the industry average ratio of 69%? Better O Worse Same Question 7 (3 points) Days sales in receivables for 2019: 20 days 38 days 30.6 days 26 days Question 8 (2 points) Is Dunder Mifflin's days sales are in receivable better or worse than the industry average ratio of 44 days? Better Worse Same tion 9 (3 points) The inventory turnover for 2019 is: 10 times 7 times 8 times 5 times Question 10 (2 points) Is Dunder Mifflin's inventory turnover better or worse than the industry average ratio of 9 times? Better Worse Same Question 11 (3 points) The return on assets (ROA) ratio for 2019 is: 23% 45% 19% 15% Question 12 (2 points) Is Dunder Mifflin's ROA ratio better or worse than the industry average ratio of 25%? Better Worse Same Question 13 (3 points) The quick ratio (acid test) for 2019 is: O 0.4 times 0.6 times 1 times 1.5 times Question 14 (2 points) Is Dunder Mifflin's quick ratio (acid test) better or worse than the industry average ratio of 0.6 times? Better Worse Same Question 1/ (3 points) The return on common shareholders equity ratio for 2019 is: 18.9% 076.4% 52.6% 78% Question 18 (2 points) Is Dunder Mifflin's return on common shareholders equity ratio better or worse than the industry average ratio of 17.6%? Better Worse Same Question 15 (3 points) The return on sales ratio for 2019 is: 24.1% 55.3% 23.2% 13.4% Question 16 (2 points) Is Dunder Mifflin's return on sales ratio better or worse than the average industry ratio of 3.9%? Better Worse Same 2018 2019 Current liabilities Accounts Payable $100,000 $80,000 50,000 150,000 90,000 170,000 Short-term Loan Total Current Liabilities Long-Term Liabilities Mortgage Total Long-Term Liabilities 285,000 285,000 285,000 285,000 435,000 Total Liabilities 455,000 Equity Share capital 100,000 190,000 Retained earnings Total equity 130,000 230,000 150,000 340,000 Equity and Liabilities $795,000 $ 665,000
Step by Step Solution
There are 3 Steps involved in it

Get step-by-step solutions from verified subject matter experts