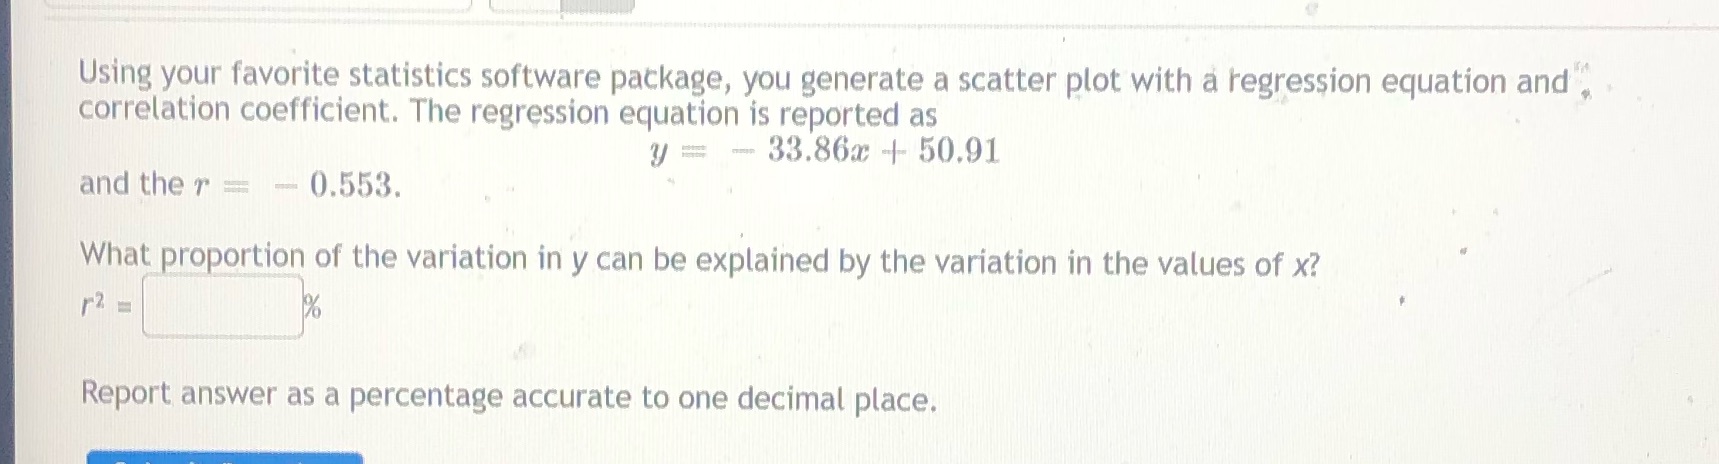
Question: Er.' Using your favorite statistics software package, you generate a scatter plot with a regression equation and ; correlation coefficient. The regression equation is reported

Er.' Using your favorite statistics software
Er.' Using your favorite statistics software package, you generate a scatter plot with a regression equation and ; correlation coefficient. The regression equation is reported as 3, e 33.86:): vi 50.9.1 and the r -- - 0.553. What proportion of the variation in y can be explained by the variation in the values of x? ' rel i. . Report answer as a percentage accurate to one decimal place

Step by Step Solution

There are 3 Steps involved in it

1 Expert Approved Answer
Step: 1 Unlock blur-text-image
Question Has Been Solved by an Expert!

Get step-by-step solutions from verified subject matter experts

Step: 2 Unlock
Step: 3 Unlock

Students Have Also Explored These Related Mathematics Questions!