

Question: Unit 3: Chapter 12.3 HW Progress save: Score: 2/9 2/5 answered 0 Question 2 v 3 Using your favorite statistics software package, you generate a
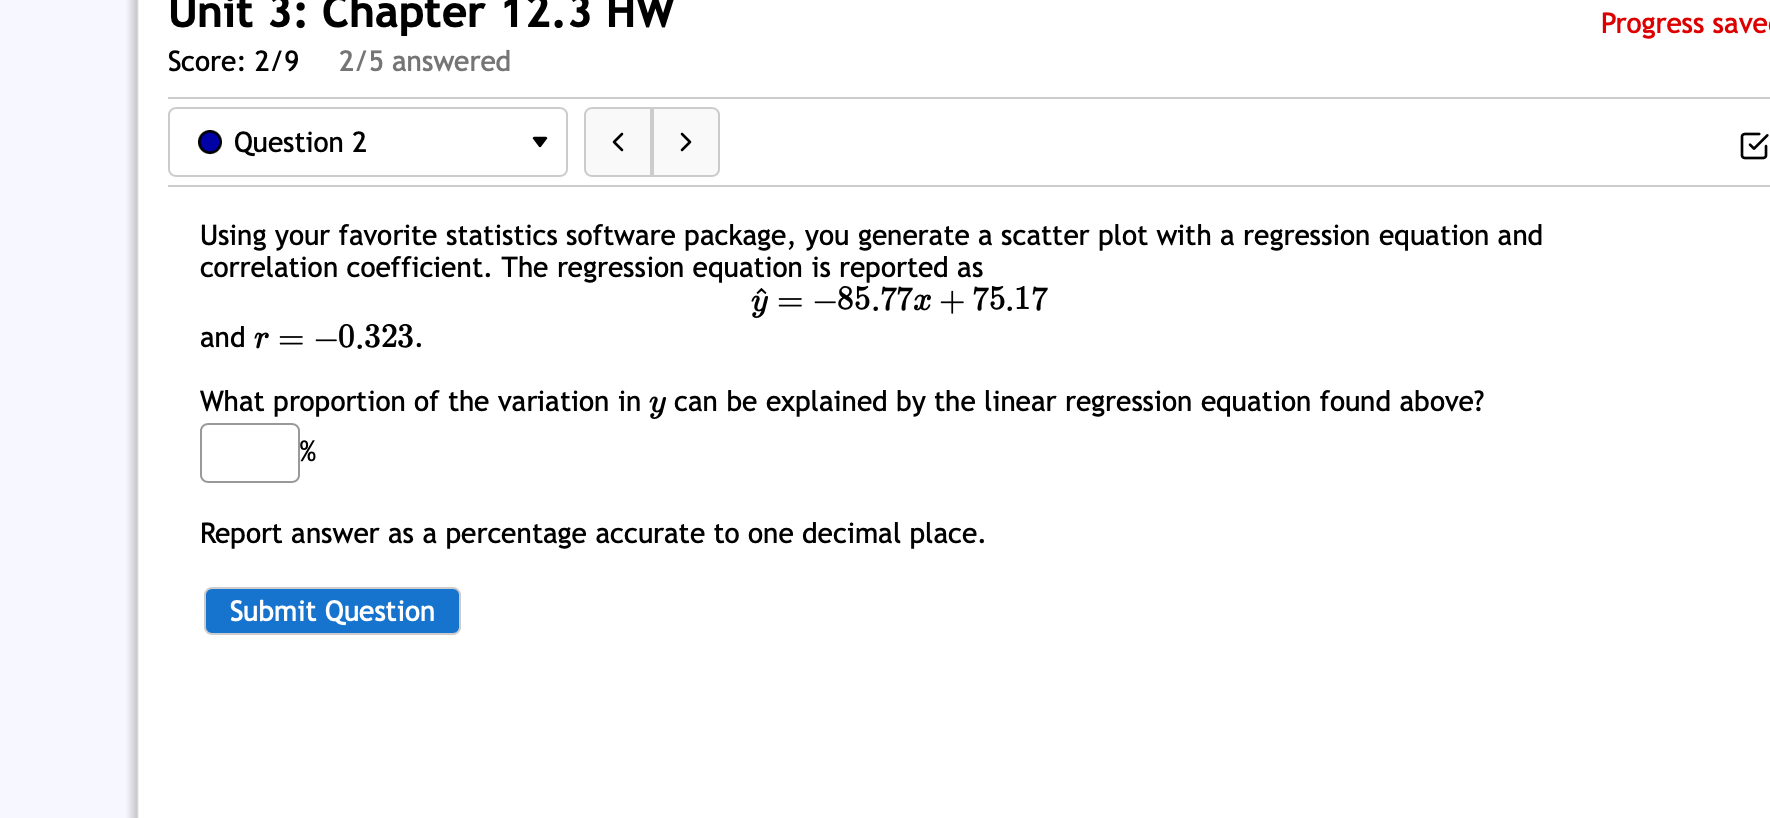
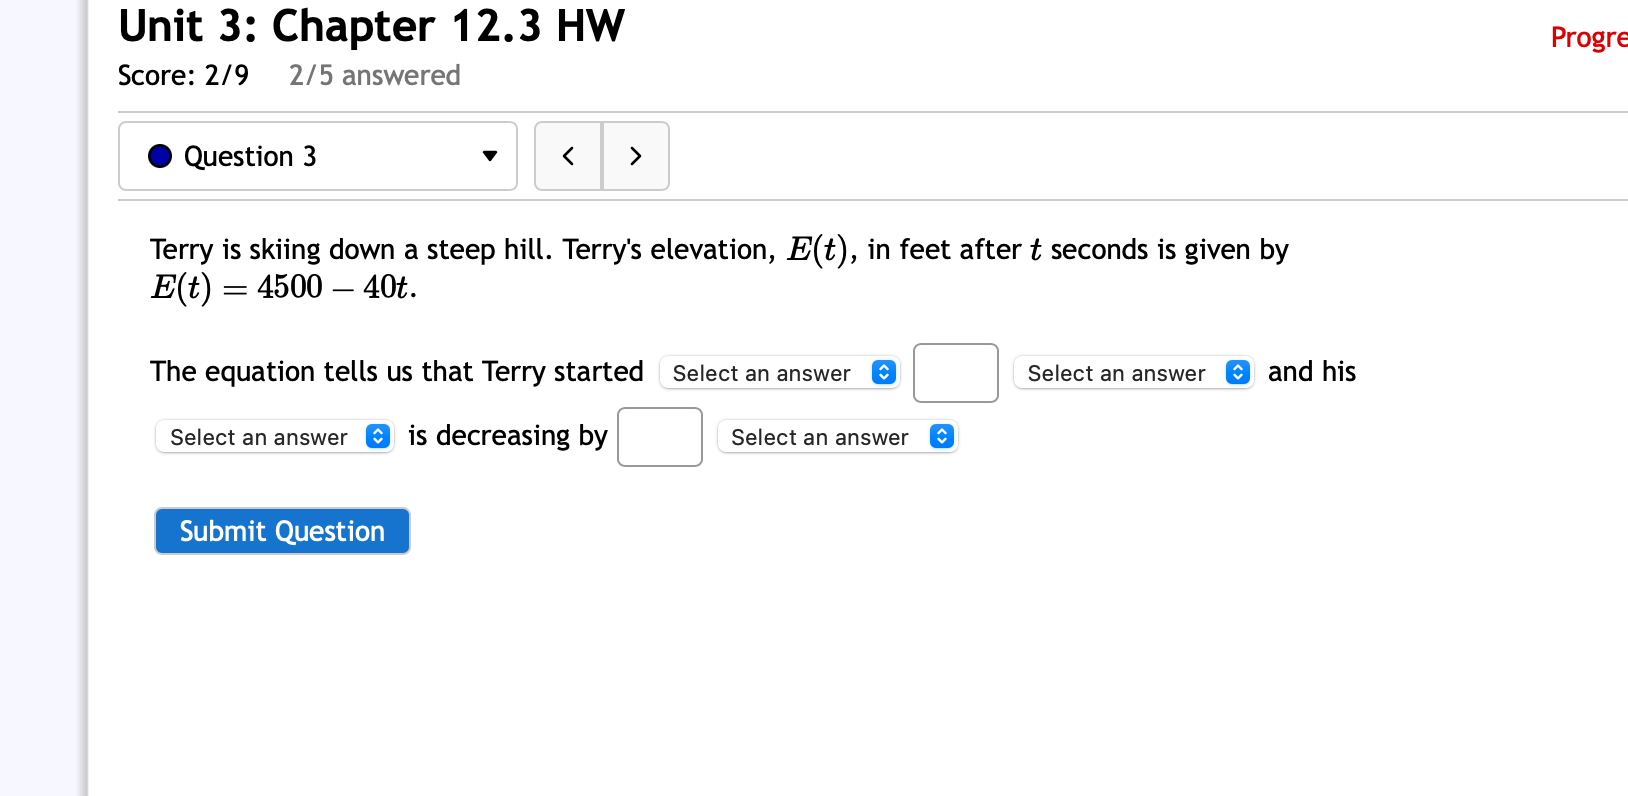
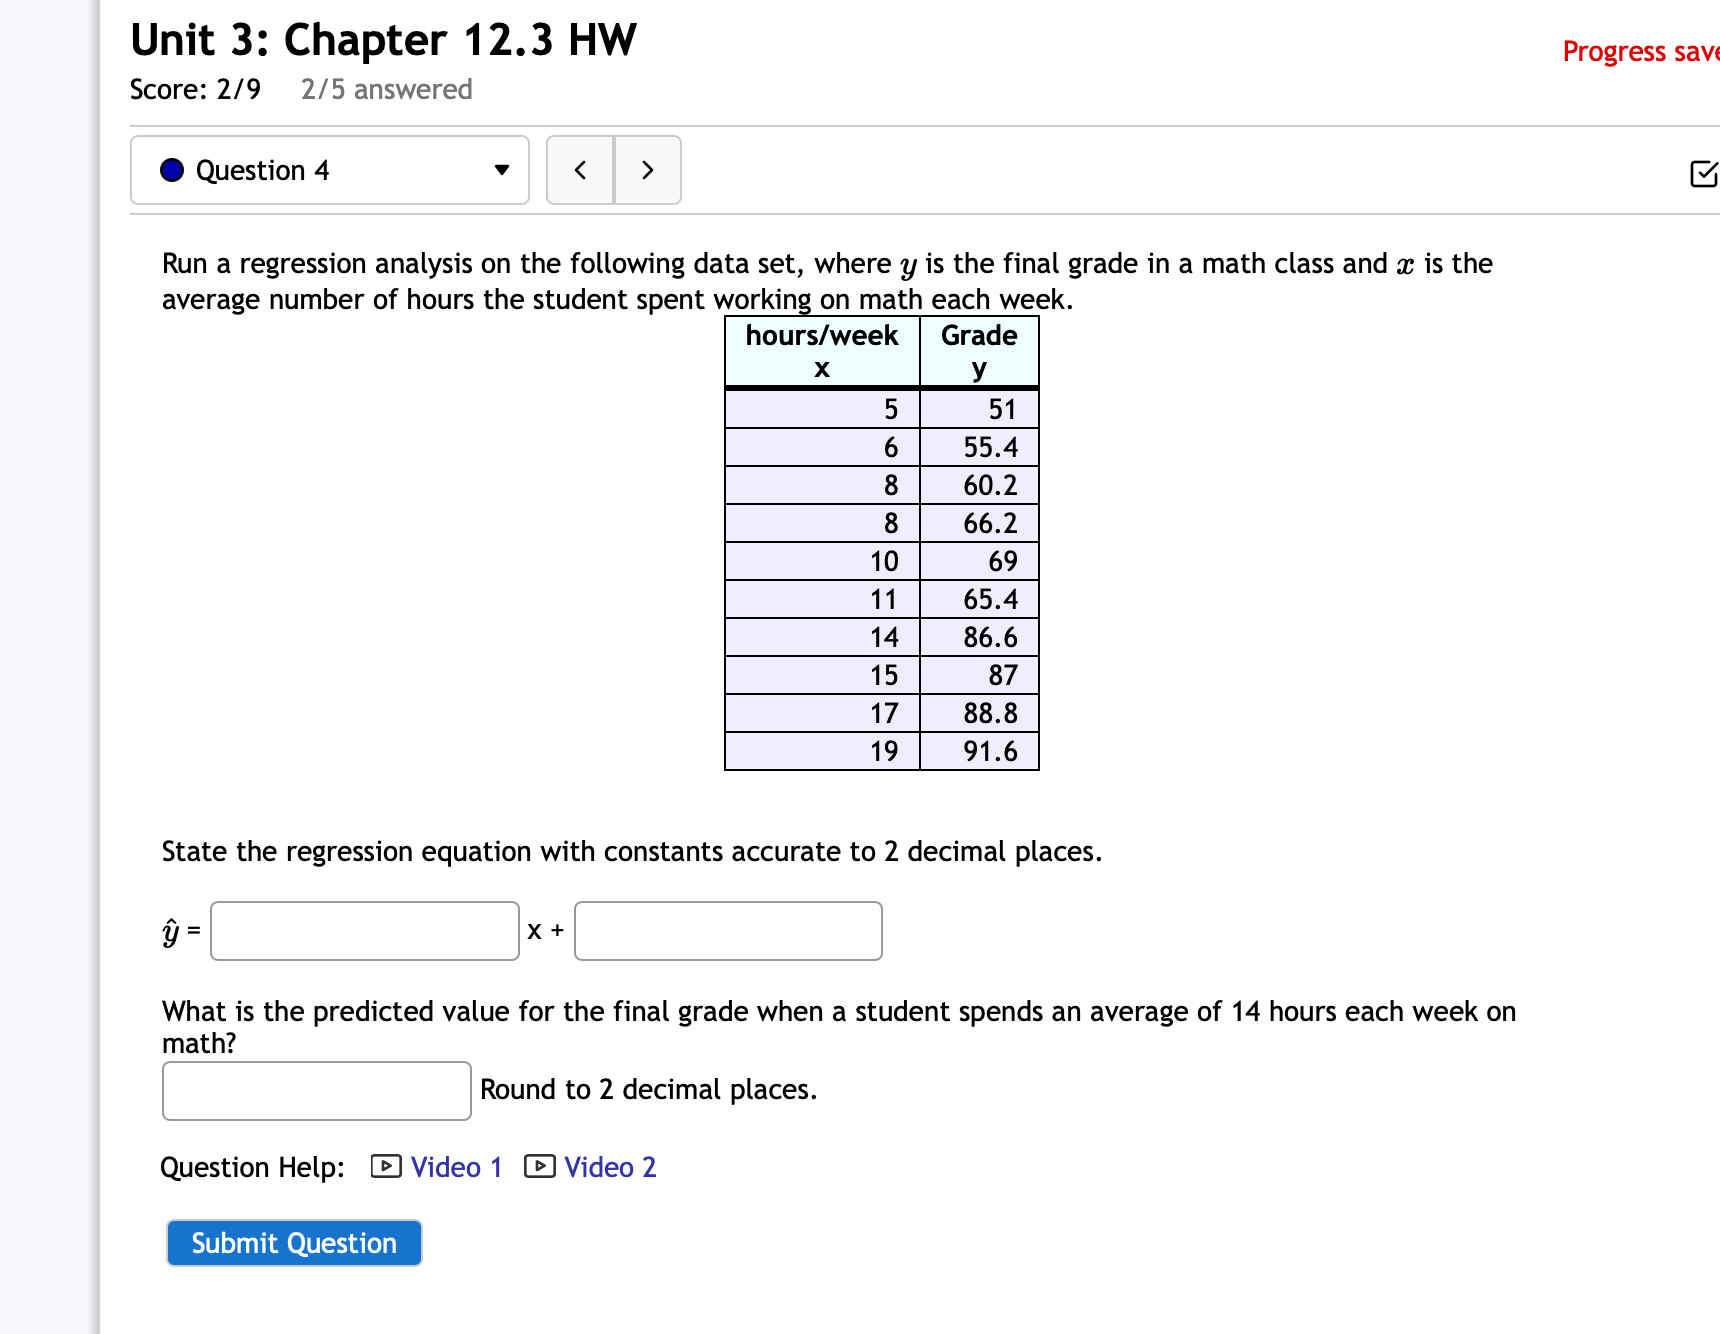
Unit 3: Chapter 12.3 HW Progress save: Score: 2/9 2/5 answered 0 Question 2 v 3 Using your favorite statistics software package, you generate a scatter plot with a regression equation and correlation coefficient. The regression equation is reported as g = 85.77:c + 75.17 and r = 0.323. What proportion of the variation in y can be explained by the linear regression equation found above? % Report answer as a percentage accurate to one decimal place. Submit Question Unit 3: Chapter 12.3 HW Progre Score: 2/9 2/5 answered 0 Question 3 v Terry is skiing down a steep hill. Terry's elevation, E(t), in feet aftert seconds is given by E(t) : 4500 401:. The equation tells us that Terry started Select an answer S Select an answer and his Select an answer a is decreasing by S Select an answer Submit Question Unit 3: Chapter 12.3 HW Progress save Score: 2/9 2/5 answered 0 Question 4 v 8 Run a regression analysis on the following data set, where y is the final grade in a math class and .7; is the average number of hours the student spent workin- on math each week. hours/week Grade X Y '- 60.2 66.2 65.4 86.6 7 88.8 State the regression equation with constants accurate to 2 decimal places. :7 = x + What is the predicted value for the final grade when a student spends an average of 14 hours each week on math? Round to 2 decimal places. Question Help: El Video 1 El Video 2 Submit
Step by Step Solution
There are 3 Steps involved in it

Get step-by-step solutions from verified subject matter experts