Question: Eskimo Pie HBR Case Study 1) use 2 DV methods to value EP as a stand alone company; discuss the risks involved in using each
Eskimo Pie HBR Case Study
1) use 2 DV methods to value EP as a stand alone company; discuss the risks involved in using each method
2) Explain in detail who will benefit if: a Reynolds sells to Nestle and b) Reynolds accepts IPO offer
3) Discuss the benefits of and provide and example of "acquisition synergy" between the two combined firms
4) Describe the potential agency issues with the IPO option
5) What is your recommendation to Reynolds and why? Support your recommendation with valuation results
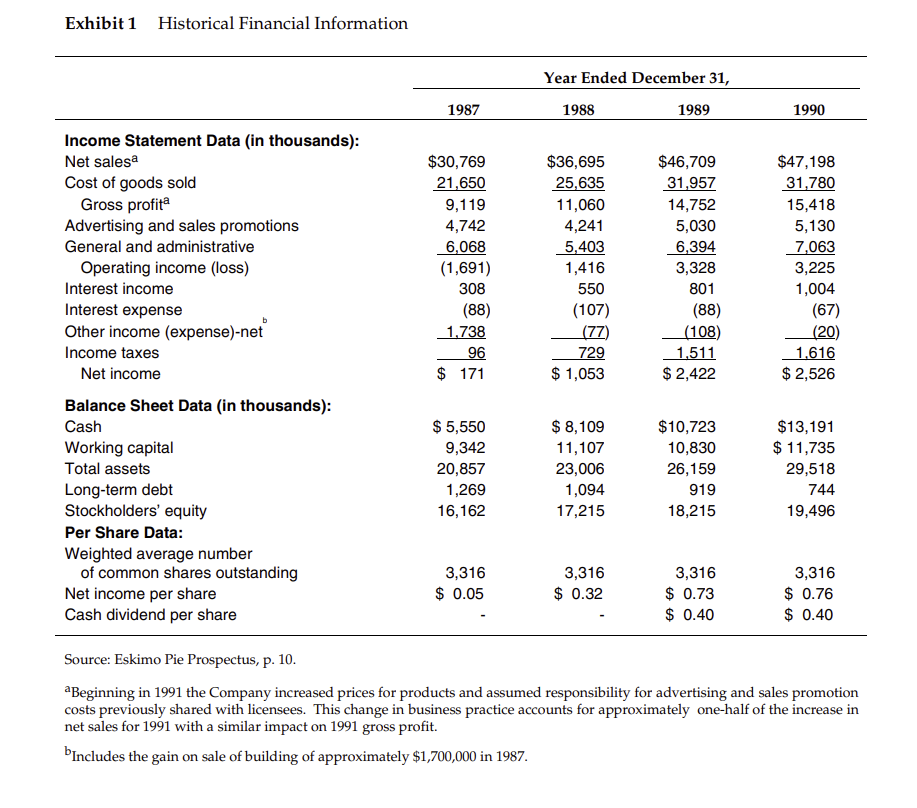
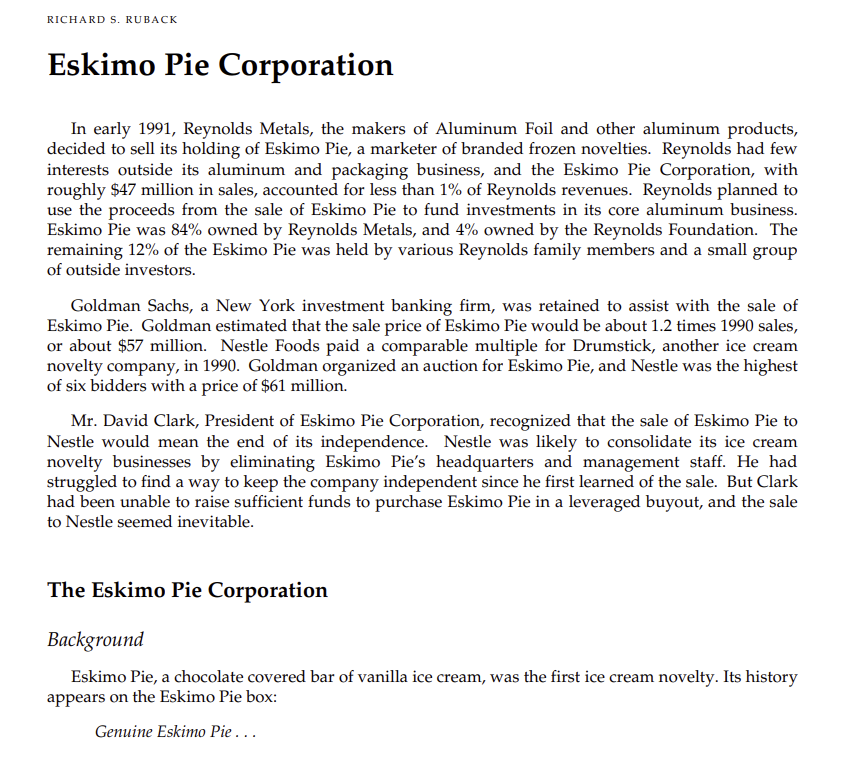
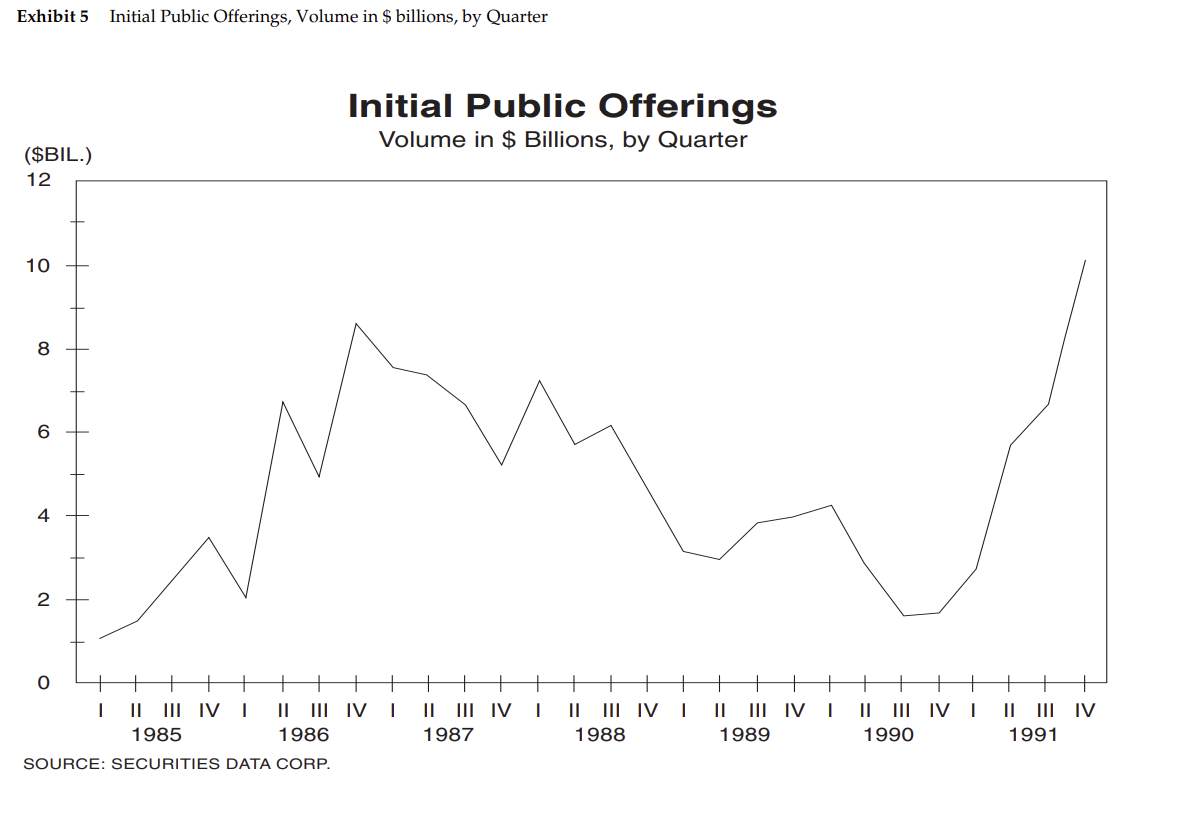
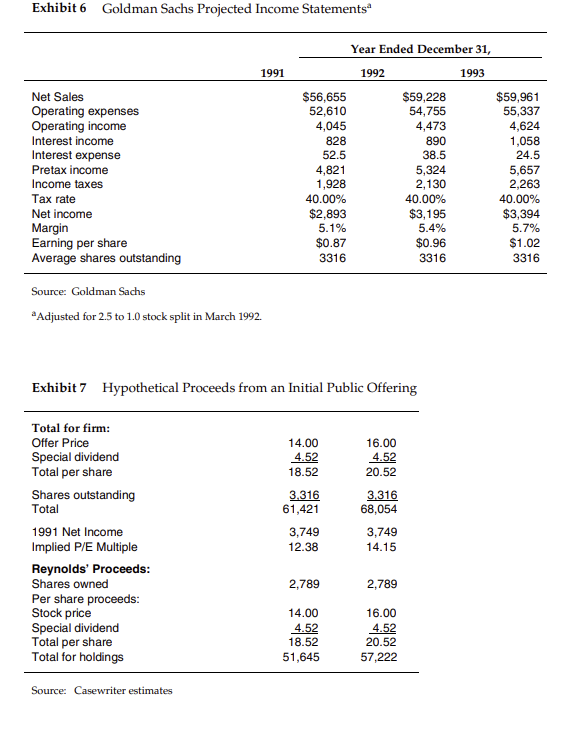
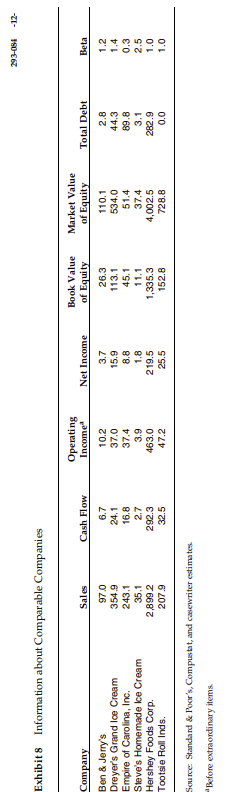
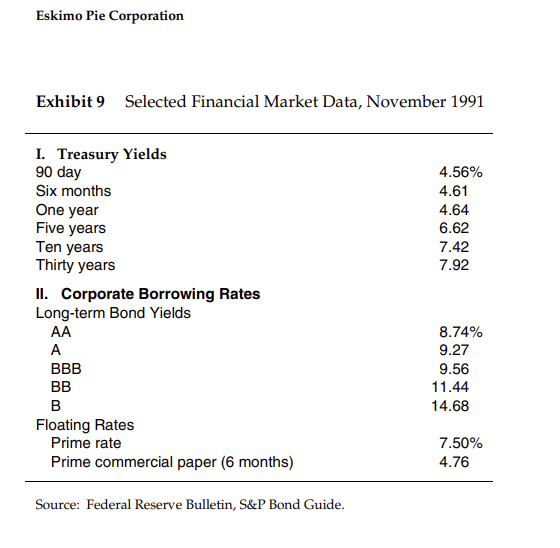
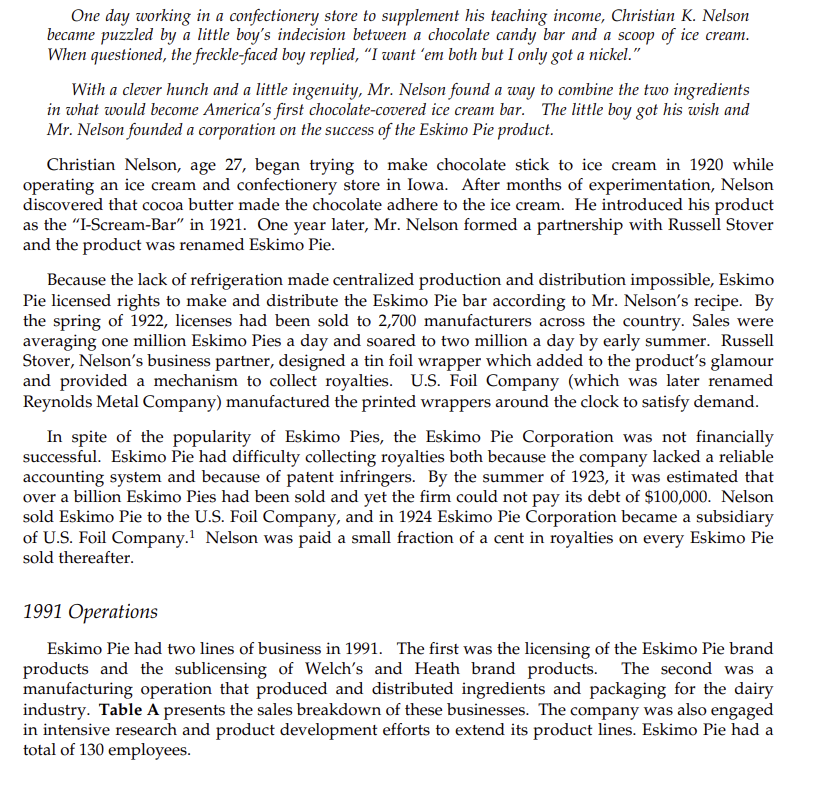
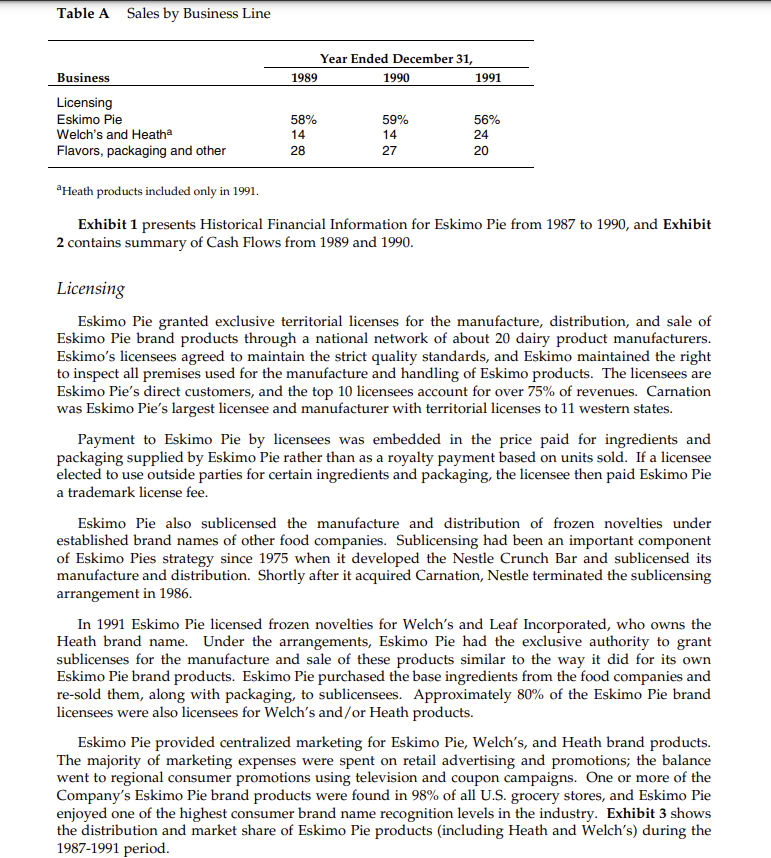
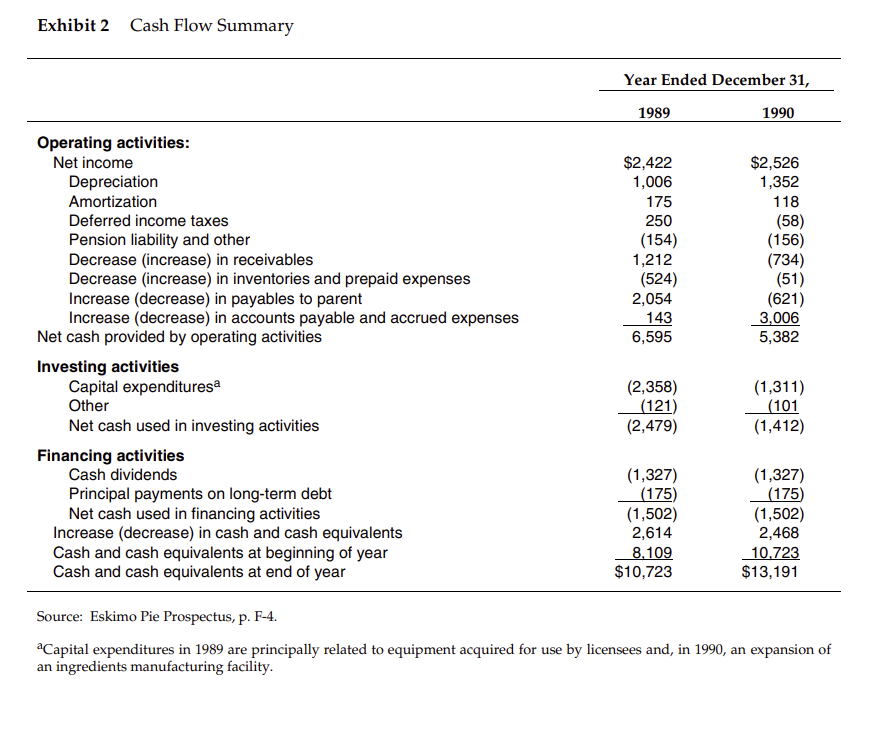
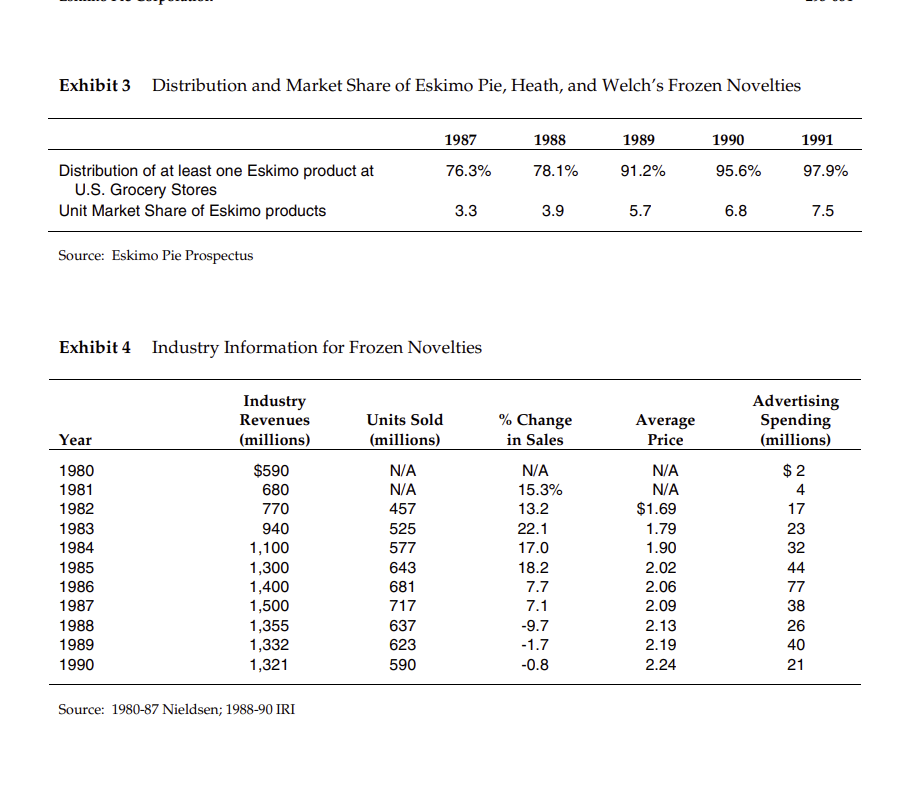
Exhibit 1 Historical Financial Information Year Ended December 31, 193'}r 1933 1939 1990 Income Statement Data {in thousands): Net salesa $30,769 $36,695 $46,709 $47,193 Cost of goods sold m w M m Gross profit3 9,119 11,060 14,752 15,413 Advertising and sales promotions 4,?42 4,241 5,030 5,130 General and administrative 6,063 5,403 6,394 7,063 Operating income (loss) (1,691) 1,416 3,323 3,225 Interest income 303 550 301 1,004 Interest expense b (33) (107} (33) (67) lC'lther income (expense)net 1,733 [77} [103) {20) Income taxes 96 729 1,511 1,616 Net income $ 171 $ 1,053 $ 2,422 $ 2,526 Balance Sheet Data (In thousands): Cash 3 5,550 $ 3,109 $10,723 $13,191 Working capital 9,342 11,107 10,330 $ 11,?35 Total assets 20,35? 23,006 26,159 29,513 Longterm debt 1,269 1,094 919 744 Stockholders equity 16,162 1?,215 16,215 19,496 Per Share Data: Weighted average number of common shares outstanding 3,316 3,316 3,316 3,316 Net income per share $ 0.05 $ 0.32 $ 0.?3 $ 0.76 Cash dividend per share - - $ 0.40 $ 0.40 Source: Eskimo Pie Prospectus, p. 10. r\"Beginning in 1991 the Company increased prices for products and assumed responsibility for advertising and sales promotion costs previously shared with licensees. This change in business practice accounts for approximately onehalf of the increase in net sales for 1991 with a similar impact on 1991 gross profit. bIncludes the gain on sale ofbuilding of approxir'rtatelj,r $1,700,000 in 198?. RICHARD S. RUBACK Eskimo Pie Corporation In early 1991, Reynolds Metals, the makers of Aluminum Foil and other aluminum products, decided to sell its holding of Eskimo Pie, a marketer of branded frozen novelties. Reynolds had few interests outside its aluminum and packaging business, and the Eskimo Pie Corporation, with roughly $47 million in sales, accounted for less than 1% of Reynolds revenues. Reynolds planned to use the proceeds from the sale of Eskimo Pie to fund investments in its core aluminum business. Eskimo Pie was 84% owned by Reynolds Metals, and 4% owned by the Reynolds Foundation. The remaining 12% of the Eskimo Pie was held by various Reynolds family members and a small group of outside investors. Goldman Sachs, a New York investment banking firm, was retained to assist with the sale of Eskimo Pie. Goldman estimated that the sale price of Eskimo Pie would be about 1.2 times 1990 sales, or about $57 million. Nestle Foods paid a comparable multiple for Drumstick, another ice cream novelty company, in 1990. Goldman organized an auction for Eskimo Pie, and Nestle was the highest of six bidders with a price of $61 million. Mr. David Clark, President of Eskimo Pie Corporation, recognized that the sale of Eskimo Pie to Nestle would mean the end of its independence. Nestle was likely to consolidate its ice cream novelty businesses by eliminating Eskimo Pie's headquarters and management staff. He had struggled to find a way to keep the company independent since he first learned of the sale. But Clark had been unable to raise sufficient funds to purchase Eskimo Pie in a leveraged buyout, and the sale to Nestle seemed inevitable. The Eskimo Pie Corporation Background Eskimo Pie, a chocolate covered bar of vanilla ice cream, was the first ice cream novelty. Its history appears on the Eskimo Pie box: Genuine Eskimo Pie . . .Exhibit 5 Initial Public Offerings, Volume in $ billions, by Quarter Initial Public Offerings ($BIL.) Volume in $ Billions, by Quarter 12 10 8 6 4 2 0 I II III IV I II III IV I II III IV I II III IV ( II III IV I II III IV I II III IV 1985 1986 1987 1988 1989 1990 1991 SOURCE: SECURITIES DATA CORP.Exhibit 6 Goldman Sachs Projected Income Statements* Year Ended December 31, 1991 1992 1993 Net Sales $56,655 $59,228 $59,961 Operating expenses 52,610 54,755 55,337 Operating income 4,045 4,473 4,624 Interest income 828 890 1,058 Interest expense 52.5 38.5 24.5 Pretax income 4,821 5,324 5,657 Income taxes 1,928 2,130 2,263 Tax rate 40.00% 40.00% 40.00% Net income $2,893 $3,195 $3,394 Margin 5.1% 5.4% 5.7% Earning per share $0.87 $0.96 $1.02 Average shares outstanding 3316 3316 3316 Source: Goldman Sachs Adjusted for 2.5 to 1.0 stock split in March 1992. Exhibit 7 Hypothetical Proceeds from an Initial Public Offering Total for firm: Offer Price 14.00 16.00 Special dividend 4.52 4.52 Total per share 18.52 20.52 Shares outstanding 3.316 3.316 Total 61,421 68,054 1991 Net Income 3,749 3,749 Implied P/E Multiple 12.38 14.15 Reynolds' Proceeds: Shares owned 2,789 2,789 Per share proceeds: Stock price 14.00 16.00 Special dividend 4.52 4.52 Total per share 18.52 20.52 Total for holdings 51,645 57,222 Source: Casewriter estimates293-084 -12- Exhibit 8 Information about Comparable Companies Operating Book Value Market Value Sales Cash Flow Income Net Income of Equity of Equity Total Debt Beta Company Ben & Jerry's 97 .0 6.7 10.2 26.3 110.1 2.B 1,4 Dreyer's Grand Ice Cream 354.9 24.1 37.0 15.9 113.1 534.0 44.3 16.8 37.4 45.1 51.4 89.8 0.3 Empire of Carolina, Inc. 243.1 3.9 1.8 11.1 37.4 3.1 2.5 Steve's Homemade Ice Cream 35.1 2.7 463.0 219.5 1,335.3 4,002.5 282.9 1.0 Hershey Foods Corp. 2,899 2 292.3 207.9 32.5 47.2 25.5 152.8 728.8 0.0 1.0 Tootsie Roll Inds. Source: Standard & Poor's, Compustat, and casewriter estimates Before extraordinary itemsEskimo Pie Corporation Exhibit 9 Selected Financial Market Data, November 1991 I. Treasury Yields 90 day 4.56% Six months 4.61 One year 4.64 Five years 6.62 Ten years 7.42 Thirty years 7.92 Il. Corporate Borrowing Rates Long-term Bond Yields AA 8.74% A 9.27 BBB 9.56 BB 11.44 B 14.68 Floating Rates Prime rate 7.50% Prime commercial paper (6 months) 4.76 Source: Federal Reserve Bulletin, S&P Bond Guide.One day working in a conctionery store to suppinent his teaching income, Christian K. Neison became puzzled by a iittte boy's indecision between a chocolate candy bar and a scoop of ice cream. When questioned, tire'ecklefaced boy replied, \"I want 'em both but i oniy got a nickel.\" With a clever bunch and a little ingenuity, Mr. Nelson formal a way to combine the two ingredients in what would become America's first chocolatecovered ice cream bar. The iittie boy got his wish and Mr. Neisonjbanded a corporation on the success of the Eskimo Pie product. Christian Nelson, age 27, began trying to make chocolate stick to ice cream in 1920 while operating an ice cream and confectionery store in Iowa. After months of experimentation, Nelson discovered that cocoa butter made the chocolate adhere to the ice cream. He introduced his product as the \"l-Scream-Bar" in 1921. One year later, Mr. Nelson formed a partnership with Russell Stover and the product was renamed Eskimo Pie. Because the lack of refrigeration made centralized production and distribution impossible, Eskimo Pie licensed rights to make and distribute the Eskimo Pie bar according to Mr. Nelson's recipe. By the spring of 1922, licenses had been sold to 2,700 manufacturers across the country. Sales were averaging one million Eskimo Pies a day and soared to two million a day by early summer. Russell Stover, Nelson's business partner, designed a tin foil wrapper which added to the product's glamour and provided a mechanism to collect royalties. U5. Foil Company (which was later renamed Reynolds Metal Company) manufactured the printed wrappers around the clock to satisfy demand. In spite of the popularity of Eskimo Pies, the Eskimo Pie Corporation was not financially successful. Eskimo Pie had difficulty collecting royalties both because the company lacked a reliable accounting system and because of patent infringers. By the summer of 1923, it was estimated that over a billion Eskimo Pies had been sold and yet the firm could not pay its debt of $100,001]. Nelson sold Eskimo Pie to the US. Foil Company, and in 1924 Eskimo Pie Corporation became a subsidiary of US. Foil Company.'1 Nelson was paid a small fraction of a cent in royalties on every Eskimo Pie sold thereafter. 1991 Operations Eskimo Pie had two lines of business in 1991. The first was the licensing of the Eskimo Pie brand products and the sublicensing of Welch's and Heath brand products. The second was a manufacturing operation that produced and distributed ingredients and packaging for the dairy industry. Table A presents the sales breakdown of these businesses. The company was also engaged in intensive research and product development efforts to extend its product lines. Eskimo Pie had a total of 130 employees. Table A Sales by Business Line Year Ended December 31, Business 1939 1990 1991 Licensing Eskimo F'ie 53% 59% 55% Welch's and HeathEl 14 14 24 Flavors, packaging and other 23 2? 2t} aHeath. pmducts included only in 199l. Exhibit 1 presents Historical Financial Information for Eskimo Pie from 198? to 1990, and Exhibit 2 contains summary of Cash Flows from 1939 and 1990. Licensing Eskimo Pie granted exclusive territorial licenses for the manufacture, distribution, and sale of Eskimo Pie brand products through a national network of about 20 dairy product manufacturers. Eskimo's licensees agreed to maintain the strict quality standards, and Eskimo maintained the right to inspect all premises used for the manufacture and handling of Eskimo products. The licensees are Eskimo Pie's direct customers, and the top 10 licensees account for over 75% of revenues. Carnation was Eskimo Pie's largest licensee and manufacturer with territorial licenses to 11 western states. Payment to Eskimo Pie by licensees was embedded in the price paid for ingredients and packaging supplied by Eskimo Pie rather than as a royalty payment based on units sold. If a licensee elected to use outside parties for certain ingredients and packaging, the licensee then paid Eskimo Pie a trademark license fee. Eskimo Pie also sublicensed the manufacture and distribution of frozen novelties under established brand names of other food companies. Sub-licensing had been an important component of Eskimo Pies strategy since 1975 when it developed the Nestle Crunch Bar and sublicensed its manufacture and distribution. Shortly after it acquired Carnation, Nestle terminated the sublicensing arrangement in 1986. In 1991 Eskimo Pie licensed frozen novelties for Welch's and Leaf Incorporated, who owns the Heath brand name. Under the arrangements, Eskimo Pie had the exclusive authority to grant sublicenses for the manufacture and sale of these products similar to the way it did for its own Eskimo Pie brand products. Eskimo Pie purchased the base ingredients from the food companies and resold them, along with packaging, to sublicensees. Approximately 80% of the Eskimo Pie brand licensees were also licensees for Welch's andfor Heath products. Eskimo Pie provided centralized marketing for Eskimo Pie, Welch's, and Heath brand products. The majority of marketing expenses were spent on retail advertising and promotions; the balance went to regional consumer promotions using television and coupon campaigns. One or more of the Company's Eskimo Pie brand products were found in 93% of all US. grocery stores, and Eskimo Pie enjoyed one of the highest consumer brand name recognition levels in the industry. Exhibit 3 shows the distribution and market share of Eskimo Pie products (including Heath and Welch's} during the l9B?1991 period. Monuciuring Eskimo Pie operated three plants in the United States. These plants manufactured key ingredients and packaging used by licensees, such as the proprietary chocolate coating, Midnil't' Sim, that gave Eskimo Pie products their distinctive flavor. The plants also produced generic ingredients and packaging sold both to licensees and non-licensees in the dairy industry. The plants employ a total of 46 hourly workers at an average hourly wage of $111.06. The plants also employed 18 salaried employees. Product Innovation Eskimo I'ie's new product program was successful; ten products introduced since 193? were being actively marketed and sold in 1991. Eskimo Pie was the first to market a sugar free frozen dairy novelty bar made with NutraSweet and held a patent on that product's coating. The introduction of Sugar Freedom Eskimo Pic products in 198? was largely responsible for the growth of Eskimo Pie's Lmit market share from 2.3% in 193? to 5.3% in 1991. As of 1991, the Sugar Freedom Eskimo Pic products were leading the Eskimo Pie line. The company was also the first to introduce a fatfree frozen novelty product made with Simplessey a patented fat substitute. By the end of 1991. Eskimo Pie was test marketing a fat free ioe cream sandwich and expected to introduce a For Freedom Eskimo Pic line in the spring of 1992. The Frozen Novelty Industry The frozen novelty industry in 1991 was highly fragmented with over 400 brands representing sales of $1.3 billion. During the 1980's, major food companies such as lGeneral Foods, Mars, and lCoca Cola entered the frozen novelties business. This transformed the industry's structure of low growth, little advertising, and few participants into a rapidly growing industry. Industry revenues went from $590 million in 1980 to $1.5 billion by 198?. The number of ice cream novelty brands, 100 in 1980, expanded to over EDD by 198?. Advertising expenditures increased from less than $2 million to $35 million per year during this period. Exhibit 4 presents the frozen novelties sales trends. By the late 1981Ts, the industry began to consolidate, with many of the larger companies exiting or significantly reducing their commitment to the frozen novelty business. By 1991, advertising expenditures had been reduced to about $25 million, and the market growth had slowed significantly. Table B shows the top five frozen novelties as ranked by unit market share in 1991. Table B 1991 Leading Frozen Novelty Brands Brand Company Unit Share Popsicle Unilever 15% Klondike Empire of Carolina 5.4 Eskimo Pie Eskimo Pie 5.3 Snickers Mars 4.8 Weight Watchers H..l. Heinz 4.3 Nestle's Offer Reynolds retained Goldman Sachs to sell Eskimo Pie because of its longstanding relationship with Reynolds and because it represented Nestle in its Drumstick acquisition. David Clark was directed to work with the Goldman Sachs team that arrived in April 1991 to prepare a sales strategy and the documentation required by buyers. Clark and his staff cooperated reluctantly, recognizing that Eskimo Pie would be unlikely to continue its F'IJ year history of operating as a standalone company in Richmond and drat its corporate staff would be unlikely to retain their positions. Exhibit 6 presents the projected income statements that Goldman collected. Eskimo Pie's management and Wheat First Securities, a Richmond, Va. investment barlking firm, formed a group to attempt a private buyout. This group obtained $20 million in credit and contributed another $15 million in equity, but the bid was rejected early on when higher offers came in. The buyout proposal could not secure additional nancing because of the generally tight credit environment and the unpopularity of high yield debt nanced LBOs. Also, Eskimo Pie could not use secured borrowing because the business was not asset intensive. Goldman contacted several potential buyers. Many expressed interest but were concerned that Eskimo Pie's licensing approach to the business diverged lrom the more traditional integrated manufacturing and marketing approach. Reynolds received six offers for Eskimo Pie. Nestle Foods was the highest bidder at $61 million. and Reynolds began negotiating the specifics of the sale in mid- 1991. Negotiations between Reynolds and Nestle progressed slowly because of two complications. First, Nestle, a Swiss company, wanted to tailor the transaction to take advantage of its tax conditions. Second, Eskimo Pie discovered in the third quarter of 1991 that a small quantity of cleanup solvents, inks and oils were disposed of at its New Jersey plant. The company contacted the regulatory authorities, and conducted testing to determine the extent of any contamination. Although Eskimo Pie did not expect cleanup costs to exceed EQUINE, Nestle remained cautious. The Proposed Initial Public Offering As the end of fiscal year 1991 approached, it was becoming apparent that Eskimo Pie was going to have a record year. Sales were higher than anticipated and operating margins had improved. In addition, Eskimo had also accumulated a $13 million cash reserve. David Clark contacted Wheat First again, searching for an alternative to the Nestle acquisition that would keep Eskimo Pie independent. Any solution would have to provide Reynolds with as much cash as the proposed acquisition. Wheat First proposed the initial public offering of Reynolds' shares Reynolds had dismissed this possibility early on, at the advice of Goldman Sachs. Goldman argued that a public offering would be worth less than a private sale because of the potential for synergies with an acquiring firm. The fact that Nestle, with its potential synergies in its Carnation and Drumstick units, had submitted the highest bid seem to confirm Goldman's reasoning. Wheat First, however, had two reasons to think that its initial public oflering might yield more than the sale to Nestle. First, as Exhibit 5 shows, the new issues market was hot, and the number of new issues and their dollar value soared. Second, Wheat First was working with an updated forecast, and it projected a more promising outlook. The forecasted 1991 net income in Exhibit 6 is $2,393,000; actual results were going to be closer to SHIELDED. And forecasted sales in 1991 were projected at about $5? million; actual sales would be about $61 million. Capital expenditures were expected to be less than $1 million in 1992. Wheat First proposed a two~step transaction. First, Eskimo Pie would pay out a $15 million or $4.52 per share special dividend. The $15 million dividend would be funded by the $13 million in cash that Eskimo Pie had accumulated and another $2 million in debt. The second step of the transaction was an initial public offering of up to 100% of the existing Eskimo Pie common shares. Wheat First suggested offering 3.3 million secondary shares with the option to offer 1015% more shares. This \"Green Shoe"2 clause would provide cash to payoff the $2 million loan and provide over $2 million in working capital. Wheat First estimated that the offering price would be between $14 and $16 a share. Exhibit 7 shows the proceeds from the initial public offerings at the two offering prices. At $16 a share, the firm and Reynolds obtained more from the IPO than from the Nestle bid of $61 million. Furthermore, even at an offering price of $14, the IPO equalled the Nestle offer, without the complications and conditions that Nestle wanted to attach to its purchase of Eskimo Pie. Exhibit 3 shows that price earnings ratios for comparable companies such as Ben 8.: Jerry's and Dreyer's Grand Ice Cream were about 30):. The S&P 500 was trading at 25 X earning at the time. Wheat First had not done business with Reynolds, and Goldman Sachs advised Reynolds Metals against the initial public offering. Goldman argued a deal with Nestle was more certain, and they remained skeptical that an initial offering could yield as much as the private sale. The sale to Nestle was likely to be closed soon, especially in light of the potential public offering. An initial public offering would take several months to complete, and Reynolds would risk changes in market conditions that would cool off the [PO market. Furthermore, an offering the size of the proposed Eskimo Pie deal would be one of Wheat First's largest. Wheat First and the management of Eskimo Pie stressed that with a public offering, the sale of Eskimo Pie by Reynolds would be made much easier, without complicated negotiations and compromises. In addition, an independent Eskimo Pie would stay in Richmond which allowed Reynolds to get liquidity while saving a local company and local jobs. Exhibit 2 Cash Flow Summary Year Ended December 31, 1939 1991) Operating activities: Net income $2,422 $2526 Depreciation 1.006 1 ,352 Amortization 175 1 1B Deierred income taxes 250 (53) Pension liability and other (154} (156) Decrease (increase) in receivables 1.212 0'34) Decrease (increase) in inventories and prepaid expenses (524) (51) Increase (decrease) in payables to parent 2.054 (621) Increase (decrease) in accounts payable and accrued expenses 143 SIDOB Net cash provided by operating activities 6.595 5.332 Investing activities lCapital expendituresa (2.353) (1 P311} Other (121} (101 Net cash used in investing activities (2.479} (1.412) Financing activities Cash dividends (1.327) (1 r3271'} Principal payments on long-term debt (1?5} (17'5I Net cash used in financing activities (1.502} (1.502) Increase (decrease) in cash and cash equivalents 2.614 2463 Cash and cash equivalents at beginning of year 3,109 10 723 Cash and cash equivalents at end of year $10,723 $13,191 Source: Eskimo Pie Prospectus, p. F4. aICt-tpitt-tl expenditures in 1989 are principally related to equipment acquired for use by licensees and, in 1990, an expansion of an ingredient; manufacturing facility. Exhibit 3 Distribution and Market Share of Eskimo Pie, Heath, and Welch's Frozen Novelties 1987 1988 1989 1990 1991 Distribution of at least one Eskimo product at 76.3% 78.1% 91.2% 95.6% 97.9% U.S. Grocery Stores Unit Market Share of Eskimo products 3.3 3.9 5.7 6.8 7.5 Source: Eskimo Pie Prospectus Exhibit 4 Industry Information for Frozen Novelties Industry Advertising Revenues Units Sold Change Average Spending Year (millions) (millions) in Sales Price (millions) 1980 $590 N/A N/A N/A $ 2 1981 680 N/A 15.3% N/A 4 1982 770 457 13.2 $1.69 17 1983 940 525 22.1 1.79 23 1984 1,100 577 17.0 1.90 32 1985 1,300 643 18.2 2.02 44 1986 1,400 681 7.7 2.06 77 1987 1,500 717 7.1 2.09 38 1988 1,355 637 -9.7 2.13 26 1989 1,332 623 -1.7 2.19 40 1990 1,321 590 0.8 2.24 21 Source: 1980-87 Nieldsen; 1988-90 IRI
Step by Step Solution
There are 3 Steps involved in it
1 Expert Approved Answer
Step: 1 Unlock
Question Has Been Solved by an Expert!
Get step-by-step solutions from verified subject matter experts
Step: 2 Unlock
Step: 3 Unlock
Students Have Also Explored These Related Finance Questions!