

Question: Please include word explanations Please answer 10.2 Modelling a Skateboard Ramp Introduction A skateboard ramp is to be constructed in the local park. The diagram
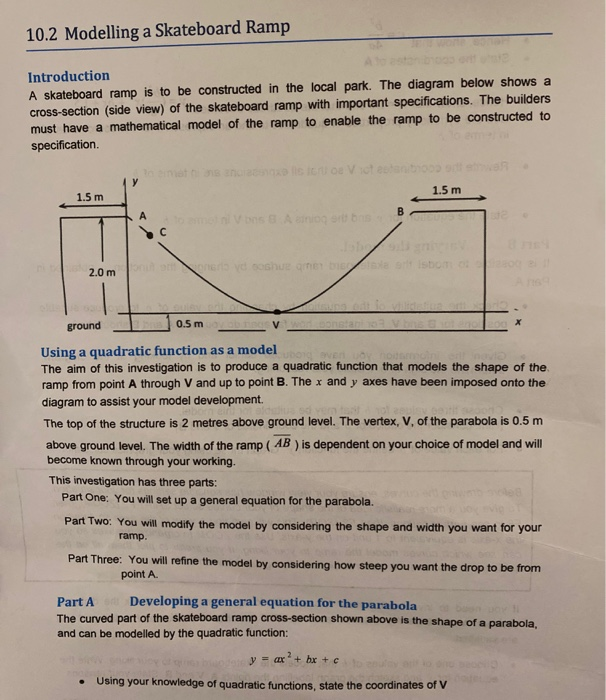
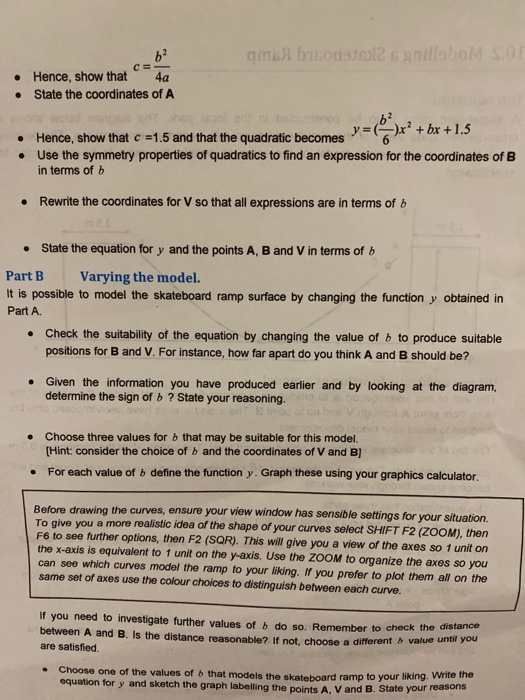
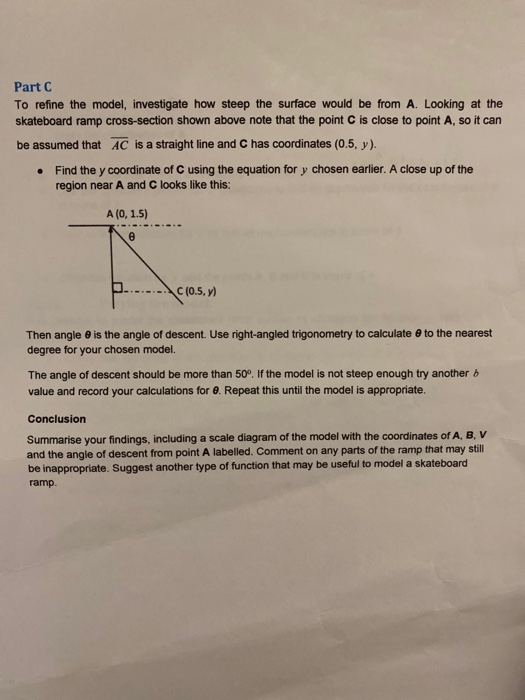
10.2 Modelling a Skateboard Ramp Introduction A skateboard ramp is to be constructed in the local park. The diagram below shows a cross-section (side view) of the skateboard ramp with important specifications. The builders must have a mathematical model of the ramp to enable the ramp to be constructed to specification OV 1.5 m 1.5 m B Von Abas Joshuabot 2.0 m ground 0.5 m V 200 x Using a quadratic function as a model The aim of this investigation is to produce a quadratic function that models the shape of the ramp from point A through V and up to point B. The x and y axes have been imposed onto the diagram to assist your model development The top of the structure is 2 metres above ground level. The vertex, V, of the parabola is 0.5 m above ground level. The width of the ramp (AB) is dependent on your choice of model and will become known through your working. This investigation has three parts: Part One: You will set up a general equation for the parabola. Part Two: You will modify the model by considering the shape and width you want for your ramp Part Three: You will refine the model by considering how steep you want the drop to be from point A. Part A Developing a general equation for the parabola The curved part of the skateboard ramp cross-section shown above is the shape of a parabola, and can be modelled by the quadratic function: y = ar? = ax + bx + c Using your knowledge of quadratic functions, state the coordinates of V go biods26 golloboM SOT b? CE Hence, show that 4a State the coordinates of A b2 Hence, show that c =1.5 and that the quadratic becomes y= x + bx +1.5 Use the symmetry properties of quadratics to find an expression for the coordinates of B in terms of b Rewrite the coordinates for V so that all expressions are in terms of b State the equation for y and the points A, B and V in terms of b Part B Varying the model. It is possible to model the skateboard ramp surface by changing the function y obtained in Part A. Check the suitability of the equation by changing the value of b to produce suitable positions for B and V. For instance, how far apart do you think A and B should be? Given the information you have produced earlier and by looking at the diagram, determine the sign of b ? State your reasoning. . Choose three values for b that may be suitable for this model. [Hint: consider the choice of b and the coordinates of Vand B] For each value of b define the function y. Graph these using your graphics calculator. Before drawing the curves, ensure your view window has sensible settings for your situation. To give you a more realistic idea of the shape of your curves Select SHIFT F2 (ZOOM), then F6 to see further options, then F2 (SQR). This will give you a view of the axes so 1 unit on the x-axis is equivalent to 1 unit on the y-axis. Use the ZOOM to organize the axes so you can see which curves model the ramp to your liking. If you prefer to plot them all on the same set of axes use the colour choices to distinguish between each curve. If you need to investigate further values of b do so. Remember to check the distance between A and B. Is the distance reasonable? If not, choose a different value until you are satisfied Choose one of the values of b that models the skateboard ramp to your liking. Write the equation for y and sketch the graph labelling the points A, V and B. State your reasons Part C To refine the model, investigate how steep the surface would be from A. Looking at the skateboard ramp cross-section shown above note that the point is close to point A, so it can be assumed that AC is a straight line and C has coordinates (0.5, y). Find the y coordinate of C using the equation for y chosen earlier. A close up of the region near A and C looks like this: A(0,1.5) C(0.5, ) Then angle is the angle of descent. Use right-angled trigonometry to calculate to the nearest degree for your chosen model. The angle of descent should be more than 50. If the model is not steep enough try another b value and record your calculations for 0. Repeat this until the model is appropriate. Conclusion Summarise your findings, including a scale diagram of the model with the coordinates of A, B, V and the angle of descent from point A labelled. Comment on any parts of the ramp that may still be inappropriate. Suggest another type of function that may be useful to model a skateboard ramp. 10.2 Modelling a Skateboard Ramp Introduction A skateboard ramp is to be constructed in the local park. The diagram below shows a cross-section (side view) of the skateboard ramp with important specifications. The builders must have a mathematical model of the ramp to enable the ramp to be constructed to specification OV 1.5 m 1.5 m B Von Abas Joshuabot 2.0 m ground 0.5 m V 200 x Using a quadratic function as a model The aim of this investigation is to produce a quadratic function that models the shape of the ramp from point A through V and up to point B. The x and y axes have been imposed onto the diagram to assist your model development The top of the structure is 2 metres above ground level. The vertex, V, of the parabola is 0.5 m above ground level. The width of the ramp (AB) is dependent on your choice of model and will become known through your working. This investigation has three parts: Part One: You will set up a general equation for the parabola. Part Two: You will modify the model by considering the shape and width you want for your ramp Part Three: You will refine the model by considering how steep you want the drop to be from point A. Part A Developing a general equation for the parabola The curved part of the skateboard ramp cross-section shown above is the shape of a parabola, and can be modelled by the quadratic function: y = ar? = ax + bx + c Using your knowledge of quadratic functions, state the coordinates of V go biods26 golloboM SOT b? CE Hence, show that 4a State the coordinates of A b2 Hence, show that c =1.5 and that the quadratic becomes y= x + bx +1.5 Use the symmetry properties of quadratics to find an expression for the coordinates of B in terms of b Rewrite the coordinates for V so that all expressions are in terms of b State the equation for y and the points A, B and V in terms of b Part B Varying the model. It is possible to model the skateboard ramp surface by changing the function y obtained in Part A. Check the suitability of the equation by changing the value of b to produce suitable positions for B and V. For instance, how far apart do you think A and B should be? Given the information you have produced earlier and by looking at the diagram, determine the sign of b ? State your reasoning. . Choose three values for b that may be suitable for this model. [Hint: consider the choice of b and the coordinates of Vand B] For each value of b define the function y. Graph these using your graphics calculator. Before drawing the curves, ensure your view window has sensible settings for your situation. To give you a more realistic idea of the shape of your curves Select SHIFT F2 (ZOOM), then F6 to see further options, then F2 (SQR). This will give you a view of the axes so 1 unit on the x-axis is equivalent to 1 unit on the y-axis. Use the ZOOM to organize the axes so you can see which curves model the ramp to your liking. If you prefer to plot them all on the same set of axes use the colour choices to distinguish between each curve. If you need to investigate further values of b do so. Remember to check the distance between A and B. Is the distance reasonable? If not, choose a different value until you are satisfied Choose one of the values of b that models the skateboard ramp to your liking. Write the equation for y and sketch the graph labelling the points A, V and B. State your reasons Part C To refine the model, investigate how steep the surface would be from A. Looking at the skateboard ramp cross-section shown above note that the point is close to point A, so it can be assumed that AC is a straight line and C has coordinates (0.5, y). Find the y coordinate of C using the equation for y chosen earlier. A close up of the region near A and C looks like this: A(0,1.5) C(0.5, ) Then angle is the angle of descent. Use right-angled trigonometry to calculate to the nearest degree for your chosen model. The angle of descent should be more than 50. If the model is not steep enough try another b value and record your calculations for 0. Repeat this until the model is appropriate. Conclusion Summarise your findings, including a scale diagram of the model with the coordinates of A, B, V and the angle of descent from point A labelled. Comment on any parts of the ramp that may still be inappropriate. Suggest another type of function that may be useful to model a skateboard ramp
Step by Step Solution
There are 3 Steps involved in it

Get step-by-step solutions from verified subject matter experts