

Question: Estimating the optimal Level of Leverage Complete the table by filling out the yellow cells. You may need to refer to worksheet Bondrating Debt Cost
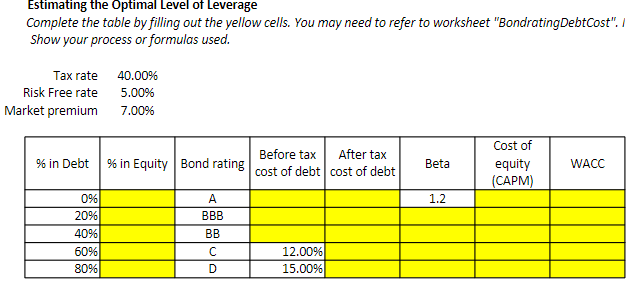
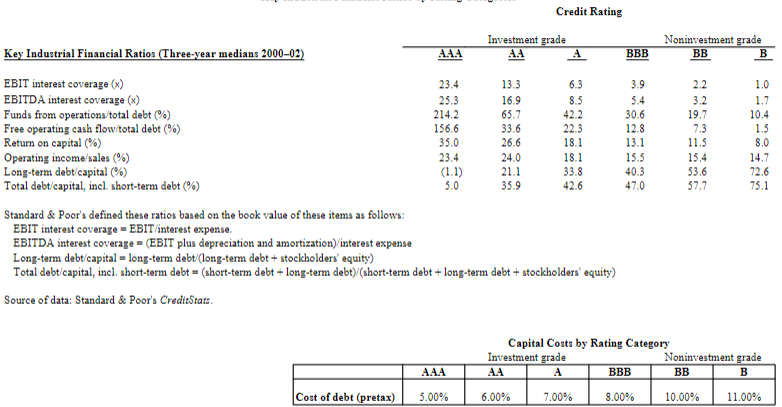
Estimating the optimal Level of Leverage Complete the table by filling out the yellow cells. You may need to refer to worksheet "Bondrating Debt Cost" / Show your process or formulas used. Tax rate 40.00% Risk Free rate 5.00% Market premium 7.00% % in Debt % in Equity Bond rating Before tax After tax cost of debt cost of debt Beta Cost of equity (CAPM) WACC 1.2 0% 20% 40% 60% 80% A BBB BB D 12.00% 15.00% Noninvestment grade BB B Credit Rating Investment grade Key Industrial Financial Ratios (Three-year medians 2000-02) A4 A BBB EBIT interest coverage (x) 23.4 13.3 6.3 3.9 EBITDA interest coverage (x) 25.3 16.9 8.3 5.4 Funds from operations/total debt %) 214.2 65.7 42.2 30.6 Free operating cash flow/total debt (%) 156.6 33.6 22.3 12.8 Return on capital (%) 35.0 26.6 18.1 13.1 Operating income/sales (%) 23.4 24.0 18.1 15.5 Long-term debt capital (*) (1.1) 21.1 33.8 40.3 Total debt/capital, incl. short-term debt (%) 5.0 35.9 42.6 47.0 Standard & Poor's defined these ratios based on the book value of these items as follows: EBIT interest coverage - EBIT/interest expense. EBITDA interest coverage = (EBIT plus depreciation and amortization) /interest expense Long-term debt/capital = long-term debt/(long-term debt + stockholders' equity) Total debt capital, incl. short-term debt = (short-term debt + long-term debty(short-term debt + long-term debt + stockholders' equity) Source of data: Standard & Poor's CreditStats. 2.2 3.2 19.7 7.3 11.5 15.4 53.6 57.7 1.0 1.7 10.4 1.5 8.0 14.7 72.6 75.1 Capital Costs by Rating Category Investment grade Noninvestment grade AAA BBB BB B Cost of debt (pretax) 5.00% 6.00% 7.00% 8.00% 10.00% 11.00%
Step by Step Solution
There are 3 Steps involved in it

Get step-by-step solutions from verified subject matter experts