

Question: Fill in the yellow boxes with equations. Estimating the optimal Level of Leverage Complete the table by filling out the yellow cells. You may need
Fill in the yellow boxes with equations.
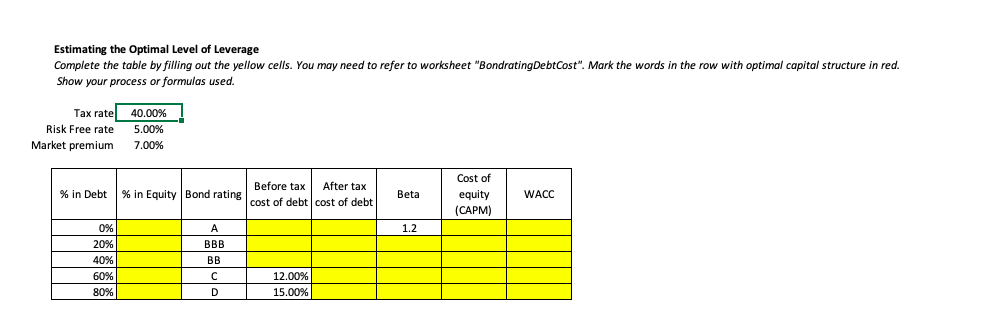
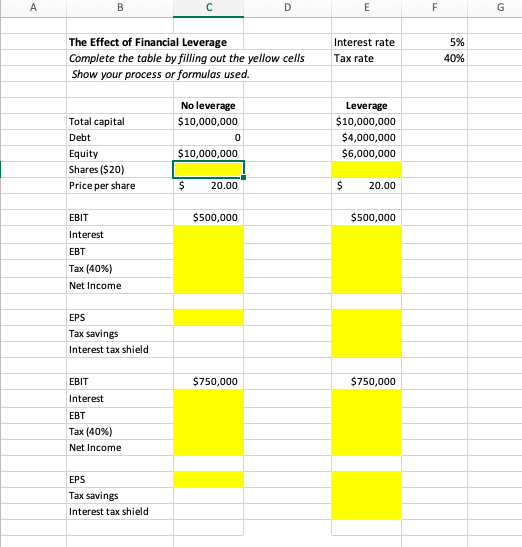
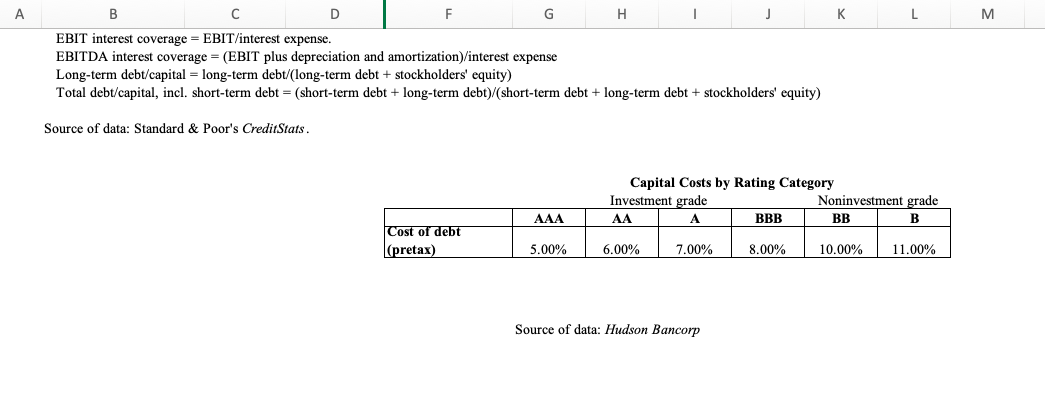
Estimating the optimal Level of Leverage Complete the table by filling out the yellow cells. You may need to refer to worksheet "Bondrating Debt Cost". Mark the words in the row with optimal capital structure in red. Show your process or formulas used. Tax rate Risk Free rate Market premium 40.00% 5.00% 7.00% % in Debt % in Equity Bond rating Before tax After tax cost of debt cost of debt Beta Cost of equity (CAPM) WACC 1.2 0% 20% 40% 60% 80% BBB BB 12.00% 15.00% A B D E F G The Effect of Financial Leverage Complete the table by filling out the yellow cells Show your process or formulas used. Interest rate Tax rate 5% 40% Total capital Debt Equity Shares ($20) Price per share No leverage $10,000,000 0 $10,000,000 Leverage $10,000,000 $4,000,000 $6,000,000 $ 20.00 $ 20.00 EBIT $500,000 $500,000 Interest EBT Tax (40%) Net Income EPS Tax savings Interest tax shield $750,000 $750,000 EBIT Interest EBT Tax (40%) Net Income EPS Tax savings Interest tax shield A K L M D G H J EBIT interest coverage = EBIT/interest expense. EBITDA interest coverage = (EBIT plus depreciation and amortization/interest expense Long-term debt/capital = long-term debt/(long-term debt + stockholders' equity) Total debt/capital, incl. short-term debt = (short-term debt + long-term debt)/(short-term debt + long-term debt + stockholders' equity) Source of data: Standard & Poor's CreditStats. Capital Costs by Rating Category Investment grade Noninvestment grade AA A BBB BB B AAA Cost of debt (pretax) 5.00% 6.00% 7.00% 8.00% 10.00% 11.00% Source of data: Hudson Bancorp Estimating the optimal Level of Leverage Complete the table by filling out the yellow cells. You may need to refer to worksheet "Bondrating Debt Cost". Mark the words in the row with optimal capital structure in red. Show your process or formulas used. Tax rate Risk Free rate Market premium 40.00% 5.00% 7.00% % in Debt % in Equity Bond rating Before tax After tax cost of debt cost of debt Beta Cost of equity (CAPM) WACC 1.2 0% 20% 40% 60% 80% BBB BB 12.00% 15.00% A B D E F G The Effect of Financial Leverage Complete the table by filling out the yellow cells Show your process or formulas used. Interest rate Tax rate 5% 40% Total capital Debt Equity Shares ($20) Price per share No leverage $10,000,000 0 $10,000,000 Leverage $10,000,000 $4,000,000 $6,000,000 $ 20.00 $ 20.00 EBIT $500,000 $500,000 Interest EBT Tax (40%) Net Income EPS Tax savings Interest tax shield $750,000 $750,000 EBIT Interest EBT Tax (40%) Net Income EPS Tax savings Interest tax shield A K L M D G H J EBIT interest coverage = EBIT/interest expense. EBITDA interest coverage = (EBIT plus depreciation and amortization/interest expense Long-term debt/capital = long-term debt/(long-term debt + stockholders' equity) Total debt/capital, incl. short-term debt = (short-term debt + long-term debt)/(short-term debt + long-term debt + stockholders' equity) Source of data: Standard & Poor's CreditStats. Capital Costs by Rating Category Investment grade Noninvestment grade AA A BBB BB B AAA Cost of debt (pretax) 5.00% 6.00% 7.00% 8.00% 10.00% 11.00% Source of data: Hudson Bancorp
Step by Step Solution
There are 3 Steps involved in it

Get step-by-step solutions from verified subject matter experts