

Question: Evaluate Gap Inc.'s financial performance. Include a complete financial analysis (using case materials only). Compare Gap's performance to Indetix and Abercrombie & Fitch. You may
Evaluate Gap Inc.'s financial performance. Include a complete financial analysis (using case materials only). Compare Gap's performance to Indetix and Abercrombie & Fitch. You may find it beneficial to use the table provided. 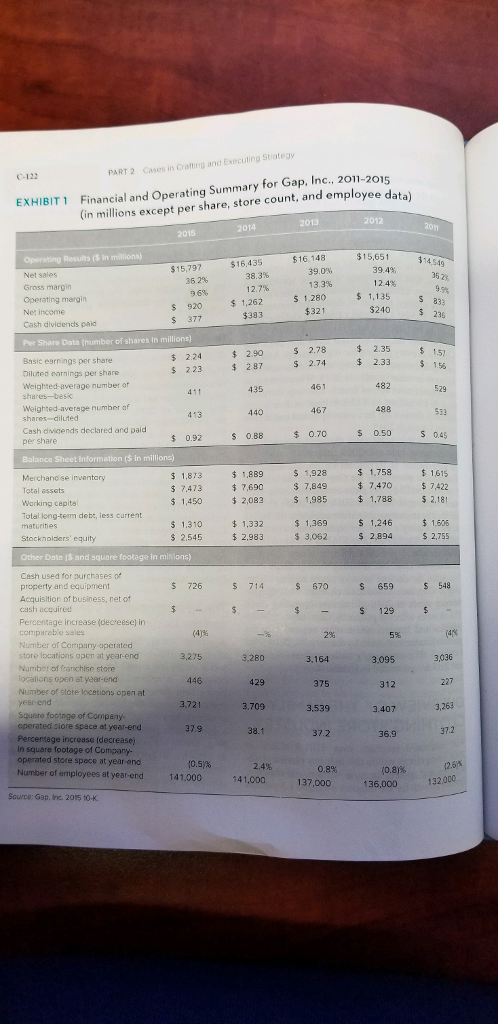
| GAP- Longitudinal Analysis | |||||
| Ratio | 2015 | 2014 | 2013 | 2012 | 2011 |
| Gross Profit Margin | |||||
| Operating Profit Margin | |||||
| Net Profit Margin | |||||
| Return on Assets | |||||
| Return on Equity | |||||
| Current Ratio | |||||
| Debt-to-Assets | |||||
| Debt-to-Equity | |||||
| Cross- Sectioinal Analysis- GAP | |||||
| Ratio | 2015 | 2014 | 2013 | ||
| Gross Profit Margin | |||||
| Operating Profit Margin | |||||
| Net Profit Margin | |||||
| Cross- Sectioinal Analysis- Inditex | |||||
| Ratio | 2015 | 2014 | 2013 | ||
| Gross Profit Margin | |||||
| Operating Profit Margin | |||||
| Net Profit Margin | |||||
| Cross- Sectioinal Analysis- A&F | |||||
| Ratio | 2015 | 2014 | 2013 | ||
| Gross Profit Margin | |||||
| Operating Profit Margin | |||||
| Net Profit Margin | |||||
PART 2 Cases in Crating and Executing Strategy Financial and Operating Summary for Gap, Inc., 2011-2015 (in millions except per share, store count, and employee dat XHIBIT1 2013 2012 2015 $16,435 16 148 $15,651 $15,797 Net sales Gross margin Operating margin Net income Cash dividends pald 390% 39.4% 36 2% 6% 38.3% 12.7% 920 1,262 1.280 13.3% 1,135 321 S 377 Per Share Data (number of shares in millions) Basic earnings per share Diluted earnings per share Weigtted-average number or S 2.78 $ 224 $ 223 $2.90 $ 287 2.74 2.33 461 41 529 Weighted-average number af 440 467 498 533 Cash dvicends declared and paid $0.92 s 088 per share s 0.70 Balance Sheet Information ($ in millions) $ 1.873 $7.473 7,690 $1450 2083 $1,889 S 1,928 S 7,849 $ 1,985 7.470 Warking cepita Total long-term deb, less current 1310 1,332 1,369 5 1,246 1.606 5 2,755 Stockholders' equity Other Data ($ and square footage in minions) Cash used for purchases or property and equipment Acquisition of business, net of cash acquired Percentage increase (decreese) in comparobie sales Number of Comparty operated store locations open at year-end Numbor of feanchise store S 726 714 S 670 659 548 (4)% 2% (4% 3,275 3.280 3.095 3,036 446 Number of store locetions open at 429 year-end Square footnge of Company- operated siore spece at year-end 3,539 3.407 3,263 Percentage increase (decrease 38.1 36.9 37.2 operated store space at year-end {0.5)% 41,000 0.8% 12.6 132.000 (0,8)% 141,000 PART 2 Cases in Crating and Executing Strategy Financial and Operating Summary for Gap, Inc., 2011-2015 (in millions except per share, store count, and employee dat XHIBIT1 2013 2012 2015 $16,435 16 148 $15,651 $15,797 Net sales Gross margin Operating margin Net income Cash dividends pald 390% 39.4% 36 2% 6% 38.3% 12.7% 920 1,262 1.280 13.3% 1,135 321 S 377 Per Share Data (number of shares in millions) Basic earnings per share Diluted earnings per share Weigtted-average number or S 2.78 $ 224 $ 223 $2.90 $ 287 2.74 2.33 461 41 529 Weighted-average number af 440 467 498 533 Cash dvicends declared and paid $0.92 s 088 per share s 0.70 Balance Sheet Information ($ in millions) $ 1.873 $7.473 7,690 $1450 2083 $1,889 S 1,928 S 7,849 $ 1,985 7.470 Warking cepita Total long-term deb, less current 1310 1,332 1,369 5 1,246 1.606 5 2,755 Stockholders' equity Other Data ($ and square footage in minions) Cash used for purchases or property and equipment Acquisition of business, net of cash acquired Percentage increase (decreese) in comparobie sales Number of Comparty operated store locations open at year-end Numbor of feanchise store S 726 714 S 670 659 548 (4)% 2% (4% 3,275 3.280 3.095 3,036 446 Number of store locetions open at 429 year-end Square footnge of Company- operated siore spece at year-end 3,539 3.407 3,263 Percentage increase (decrease 38.1 36.9 37.2 operated store space at year-end {0.5)% 41,000 0.8% 12.6 132.000 (0,8)% 141,000
Step by Step Solution
There are 3 Steps involved in it

Get step-by-step solutions from verified subject matter experts