

Question: Evaluate the company's operating data; develop a forecast of the operating data for the most recent quarter and the probabilities of achieving them, Prepare an
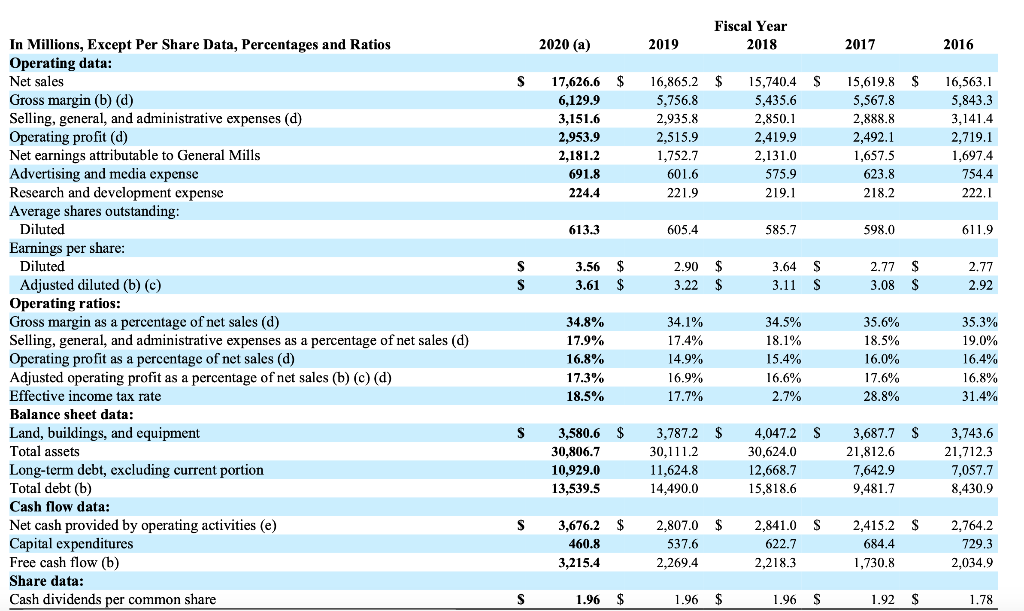
Evaluate the company's operating data; develop a forecast of the operating data for the most recent quarter and the probabilities of achieving them, Prepare an analysis based on the above investigation, and Recommend an appropriate course of action for improving the corporate performance. Fiscal Year 2018 2020 (a) 2019 2017 2016 S $ S 17,626.6 6,129.9 3,151.6 2,953.9 2,181.2 691.8 224.4 16,865.2 5,756.8 2,935.8 2,515.9 1,752.7 601.6 221.9 15,740.4 S 5,435.6 2,850.1 2,419.9 2,131.0 575.9 219.1 15,619.8 5,567.8 2,888.8 2,492.1 1,657.5 623.8 218.2 16,563.1 5,843.3 3,141.4 2,719.1 1,697.4 754.4 222.1 613.3 605.4 585.7 598.0 611.9 S $ S 3.56 3.61 2.90 3.22 3.64 3.11 2.77 3.08 $ S 2.77 2.92 S $ $ S In Millions, Except Per Share Data, Percentages and Ratios Operating data: Net sales Gross margin (b) (d) Selling, general, and administrative expenses (d) Operating profit (d) Net earnings attributable to General Mills Advertising and media expense Research and development expense Average shares outstanding: Diluted Earnings per share: Diluted Adjusted diluted (b) (c) Operating ratios: Gross margin as a percentage of net sales (d) Selling, general, and administrative expenses as a percentage of net sales (d) Operating profit as a percentage of net sales (d) Adjusted operating profit as a percentage of net sales (b) (c) (d) Effective income tax rate Balance sheet data: Land, buildings, and equipment Total assets Long-term debt, excluding current portion Total debt (b) Cash flow data: Net cash provided by operating activities (e) Capital expenditures Free cash flow (b) Share data: Cash dividends per common share 34.8% 17.9% 16.8% 17.3% 18.5% 34.1% 17.4% 14.9% 16.9% 17.7% 34.5% 18.1% 15.4% 16.6% 2.7% 35.6% 18.5% 16.0% 17.6% 28.8% 35.3% 19.0% 16.4% 16.8% 31.4% $ S 3,687.7 $ 21,812.6 3,580.6 $ 30,806.7 10,929.0 13,539.5 3,787.2 30.111.2 11,624.8 14,490.0 4,047.2 30,624.0 12,668.7 15,818.6 7,642.9 3,743.6 21,712.3 7,057.7 8,430.9 9,481.7 S $ $ S 3,676.2 460.8 3,215.4 2,807.0 537,6 2,269.4 2,841.0 622.7 2.218.3 2,415.2 $ 684.4 1,730.8 2,764.2 729.3 2,034.9 S 1.96 $ 1.96 $ 1.96 S 1.92 S 1.78 Evaluate the company's operating data; develop a forecast of the operating data for the most recent quarter and the probabilities of achieving them, Prepare an analysis based on the above investigation, and Recommend an appropriate course of action for improving the corporate performance. Fiscal Year 2018 2020 (a) 2019 2017 2016 S $ S 17,626.6 6,129.9 3,151.6 2,953.9 2,181.2 691.8 224.4 16,865.2 5,756.8 2,935.8 2,515.9 1,752.7 601.6 221.9 15,740.4 S 5,435.6 2,850.1 2,419.9 2,131.0 575.9 219.1 15,619.8 5,567.8 2,888.8 2,492.1 1,657.5 623.8 218.2 16,563.1 5,843.3 3,141.4 2,719.1 1,697.4 754.4 222.1 613.3 605.4 585.7 598.0 611.9 S $ S 3.56 3.61 2.90 3.22 3.64 3.11 2.77 3.08 $ S 2.77 2.92 S $ $ S In Millions, Except Per Share Data, Percentages and Ratios Operating data: Net sales Gross margin (b) (d) Selling, general, and administrative expenses (d) Operating profit (d) Net earnings attributable to General Mills Advertising and media expense Research and development expense Average shares outstanding: Diluted Earnings per share: Diluted Adjusted diluted (b) (c) Operating ratios: Gross margin as a percentage of net sales (d) Selling, general, and administrative expenses as a percentage of net sales (d) Operating profit as a percentage of net sales (d) Adjusted operating profit as a percentage of net sales (b) (c) (d) Effective income tax rate Balance sheet data: Land, buildings, and equipment Total assets Long-term debt, excluding current portion Total debt (b) Cash flow data: Net cash provided by operating activities (e) Capital expenditures Free cash flow (b) Share data: Cash dividends per common share 34.8% 17.9% 16.8% 17.3% 18.5% 34.1% 17.4% 14.9% 16.9% 17.7% 34.5% 18.1% 15.4% 16.6% 2.7% 35.6% 18.5% 16.0% 17.6% 28.8% 35.3% 19.0% 16.4% 16.8% 31.4% $ S 3,687.7 $ 21,812.6 3,580.6 $ 30,806.7 10,929.0 13,539.5 3,787.2 30.111.2 11,624.8 14,490.0 4,047.2 30,624.0 12,668.7 15,818.6 7,642.9 3,743.6 21,712.3 7,057.7 8,430.9 9,481.7 S $ $ S 3,676.2 460.8 3,215.4 2,807.0 537,6 2,269.4 2,841.0 622.7 2.218.3 2,415.2 $ 684.4 1,730.8 2,764.2 729.3 2,034.9 S 1.96 $ 1.96 $ 1.96 S 1.92 S 1.78
Step by Step Solution
There are 3 Steps involved in it

Get step-by-step solutions from verified subject matter experts