

Question: Evaluate the current and quick ratios as a trend analysis (year-over-year) and when compared to the industry averages. What do these numbers tell us about
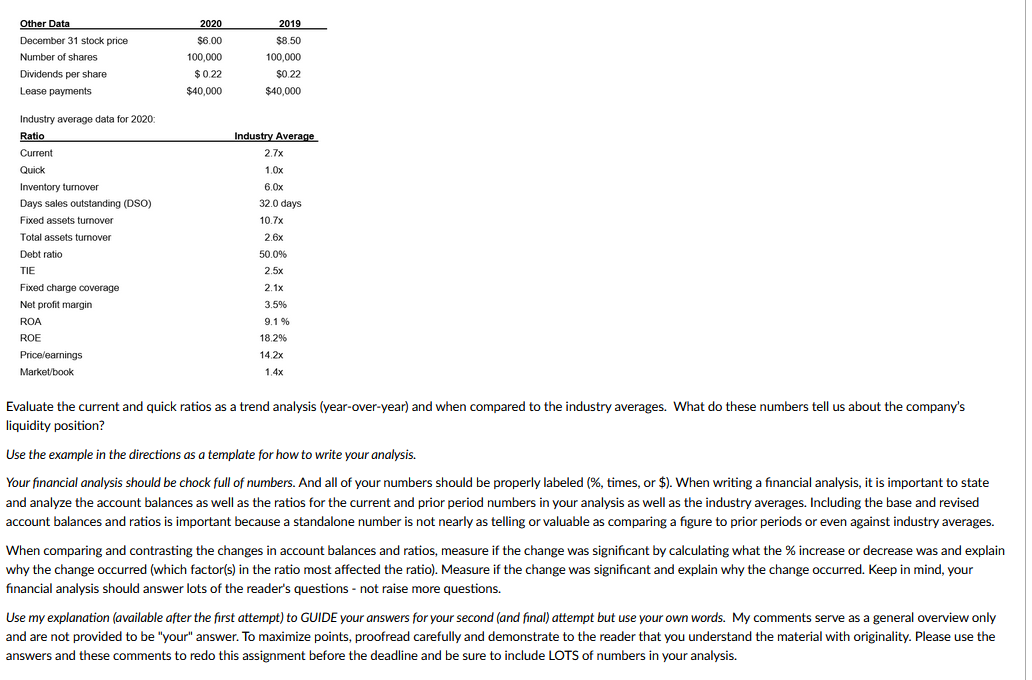
Evaluate the current and quick ratios as a trend analysis (year-over-year) and when compared to the industry averages. What do these numbers tell us about the company's liquidity position? Use the example in the directions as a template for how to write your analysis. Your financial analysis should be chock full of numbers. And all of your numbers should be properly labeled (\%, times, or \$). When writing a financial analysis, it is important to state and analyze the account balances as well as the ratios for the current and prior period numbers in your analysis as well as the industry averages. Including the base and revised account balances and ratios is important because a standalone number is not nearly as telling or valuable as comparing a figure to prior periods or even against industry averages. When comparing and contrasting the changes in account balances and ratios, measure if the change was significant by calculating what the \% increase or decrease was and explai why the change occurred (which factor(s) in the ratio most affected the ratio). Measure if the change was significant and explain why the change occurred. Keep in mind, your financial analysis should answer lots of the reader's questions - not raise more questions. Use my explanation (available after the first attempt) to GUIDE your answers for your second (and final) attempt but use your own words. My comments serve as a general overview only and are not provided to be "your" answer. To maximize points, proofread carefully and demonstrate to the reader that you understand the material with originality. Please use the answers and these comments to redo this assignment before the deadline and be sure to include LOTS of numbers in your analysis
Step by Step Solution
There are 3 Steps involved in it

Get step-by-step solutions from verified subject matter experts