

Question: Evaluate the current situation at Premier Furniture using ratio analysis for Designers and Walcott. Calculate the ratios and briefly discuss your findings. Specifically, we need
Evaluate the current situation at Premier Furniture using ratio analysis for Designers and Walcott. Calculate the ratios and briefly discuss your findings. Specifically, we need to do a ratio analysis for Designers and Walcott using their balance sheets and income statements. For Designers, assume a 42% tax rate. For Walcott, you do not need a tax rate.Report your ratios in two exhibits. See the following page for sample exhibits. Hints: Excel file explains how to calculate ratios.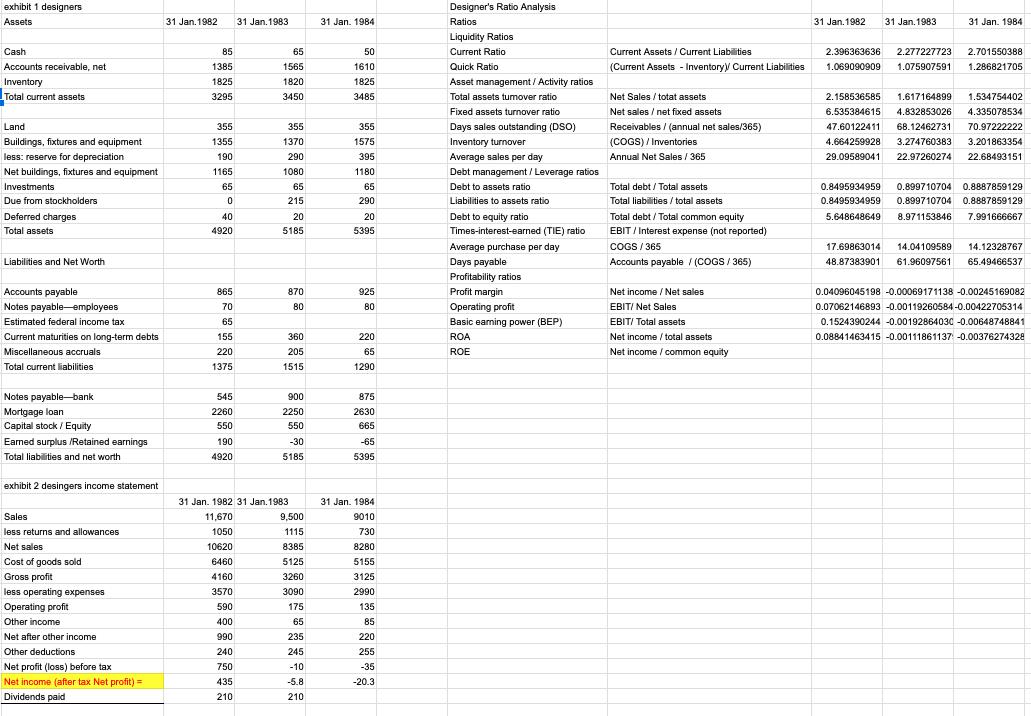
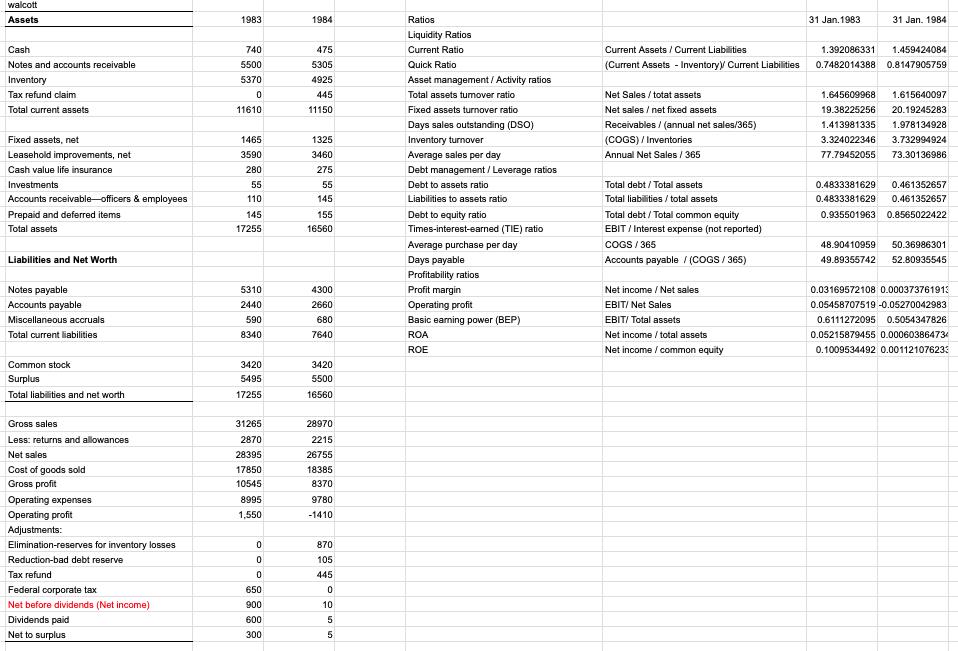
exhibit 1 designers Assets Cash Accounts receivable, net Inventory Total current assets Land Buildings, fixtures and equipment less: reserve for depreciation Net buildings, fixtures and equipment Investments Due from stockholders Deferred charges Total assets Liabilities and Net Worth Accounts payable Notes payable-employees Estimated federal income tax Current maturities on long-term debts Miscellaneous accruals Total current liabilities Notes payable-bank Mortgage loan Capital stock/Equity Earned surplus /Retained earnings Total liabilities and net worth exhibit 2 desingers income statement Sales less returns and allowances Net sales Cost of goods sold Gross profit less operating expenses Operating profit Other income Net after other income Other deductions Net profit (loss) before tax Net income (after tax Net profit) = Dividends paid 31 Jan. 1982 85 1385 1825 3295 355 1355 190 1165 65 0 40 4920 865 70 65 155 220 1375 545 2260 550 190 4920 31 Jan. 1983 65 1565 1820 3450 355 1370 290 1080 65 215 20 5185 870 80 360 205 1515 900 2250 550 -30 5185 31 Jan. 1982 31 Jan. 1983 11,670 1050 10620 6460 4160 3570 590 400 990 240 750 435 210 9,500 1115 8385 5125 3260 3090 175 65 235 245 -10 -5.8 210 31 Jan. 1984 50 1610 1825 3485 355 1575 395 1180 65 290 20 5395 925 80 220 65 1290 875 2630 665 -65 5395 31 Jan. 1984 9010 730 8280 5155 3125 2990 135 85 220 255 -35 -20.3 Designer's Ratio Analysis Ratios Liquidity Ratios Current Ratio Quick Ratio Asset management / Activity ratios Total assets tumover ratio Fixed assets turnover ratio Days sales outstanding (DSO) Inventory turnover Average sales per day Debt management / Leverage ratios Debt to assets ratio. Liabilities to assets ratio Debt to equity ratio Times-interest-earned (TIE) ratio Average purchase per day Days payable Profitability ratios Profit margin Operating profit Basic earning power (BEP) ROA ROE Current Assets / Current Liabilities (Current Assets -Inventory Current Liabilities Net Sales/totat assets. Net sales / net fixed assets Receivables /(annual net sales/365) (COGS)/Inventories Annual Net Sales / 365 Total debt / Total assets Total liabilities/total assets Total debt/Total common equity EBIT/ Interest expense (not reported) COGS/365 Accounts payable / (COGS/365) Net income / Net sales EBIT/ Net Sales EBIT/ Total assets Net income / total assets Net income /common equity 31 Jan.1982 31 Jan. 1983 31 Jan. 1984 2.396363636 2.277227723 2.701550388 1.069090909 1.075907591 1.286821705 2.158536585 1.617164899 1.534754402 6.535384615 4.832853026 4.335078534 47.60122411 68.12462731 70.97222222 4.664259928 3.274760383 3.201863354 29.09589041 22.97260274 22.68493151 0.8495934959 0.899710704 0.8887859129 0.8495934959 0.899710704 0.8887859129 5.648648649 8.971153846 7.991666667 17.69863014 14.04109589 14.12328767 48.87383901 61.96097561 65.49466537 0.04096045198 -0.00069171138 -0.00245169082 0.07062146893 -0.00119260584-0.00422705314 0.1524390244 -0.00192864030 -0.00648748841 0.08841463415 -0.00111861137 -0.00376274328
Step by Step Solution
3.50 Rating (157 Votes )
There are 3 Steps involved in it
Based on the data provided here are the calculated ratios and findings for both Designers and Walcott Exhibit 1 Designers 1 Liquidity Ratios Current R... View full answer

Get step-by-step solutions from verified subject matter experts