

Evaluate the performance of Community National Bank using the data in Exhibit 3.2, 3.4 and 3.6....
Fantastic news! We've Found the answer you've been seeking!
Question:
Transcribed Image Text:
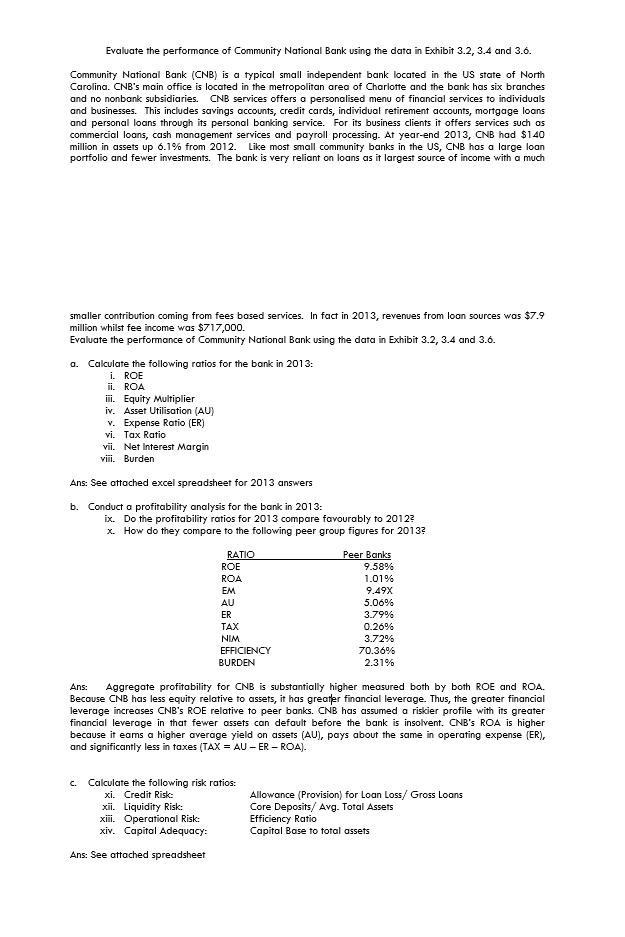
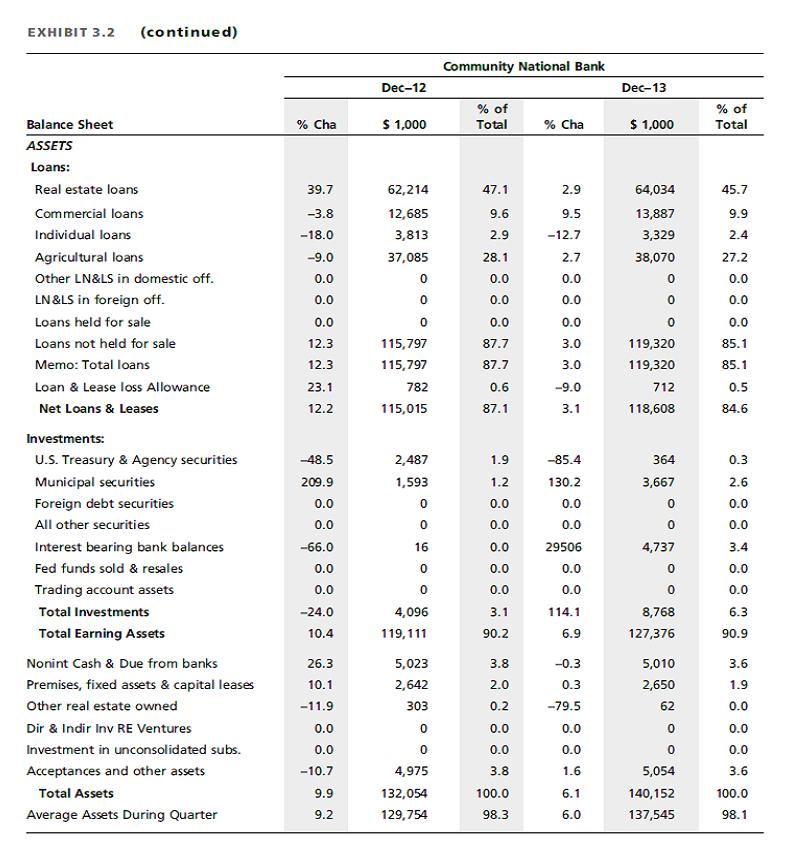
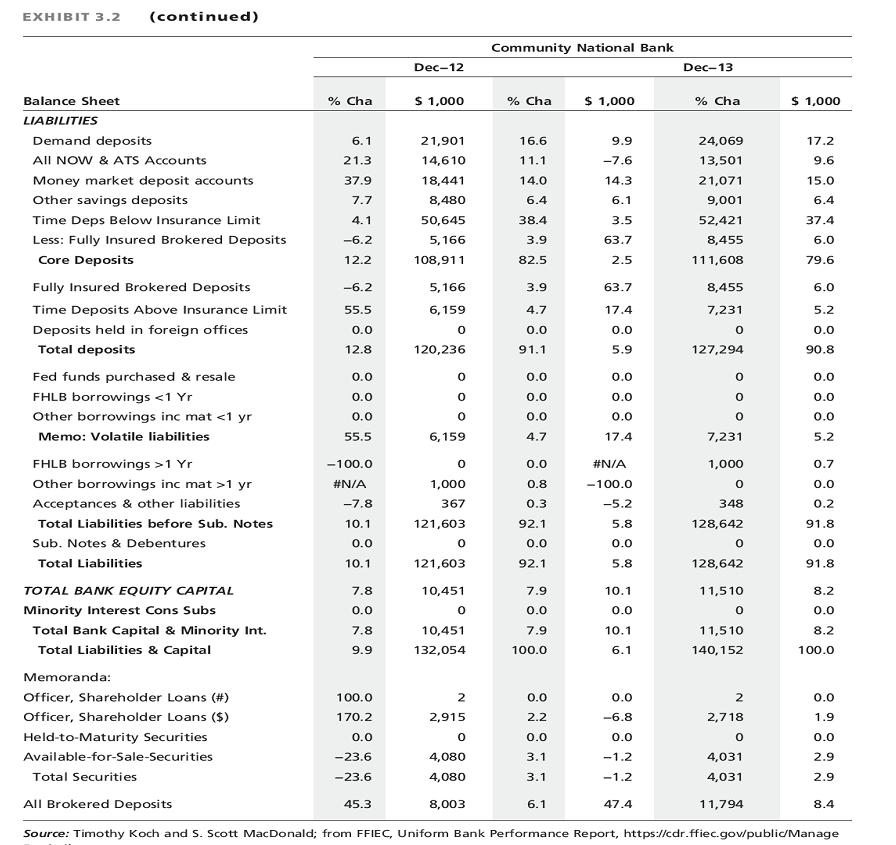
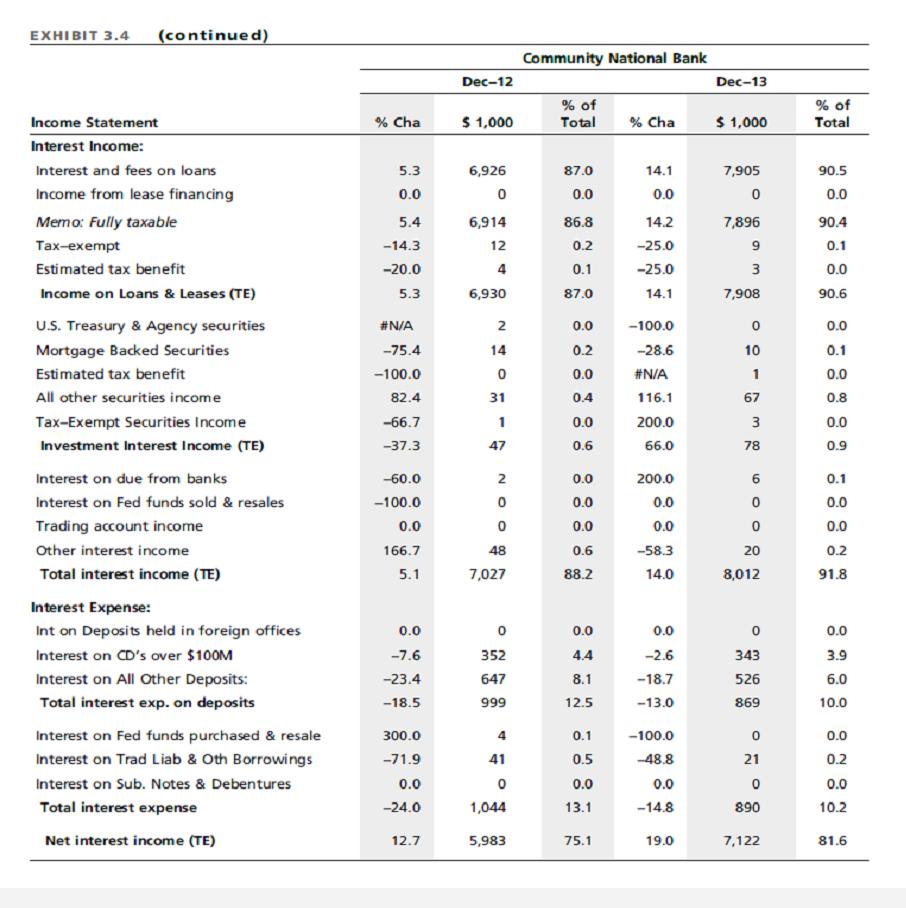
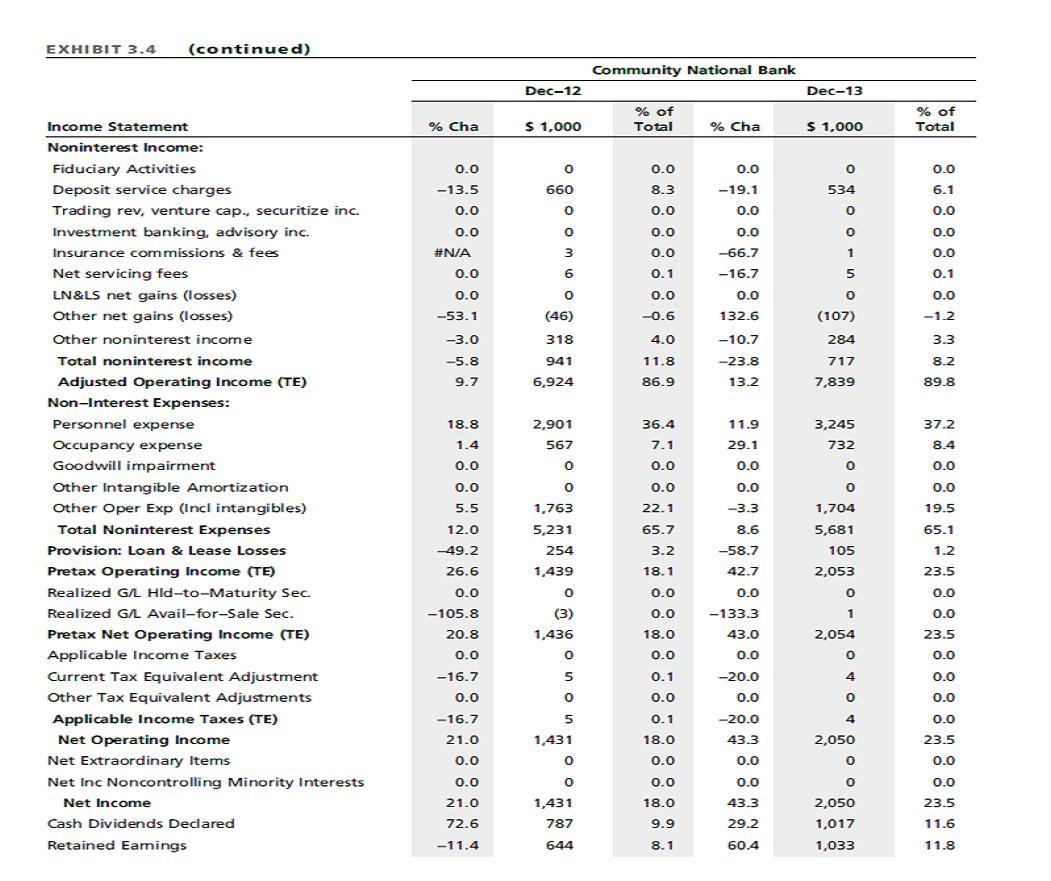
Evaluate the performance of Community National Bank using the data in Exhibit 3.2, 3.4 and 3.6. Community National Bank (CNB) is a typical small independent bank located in the US state of North Carolina. CNB's main office is located in the metropolitan area of Charlotte and the bank has six branches and no nonbank subsidiaries. CNB services offers a personalised menu of financial services to individuals and businesses. This includes savings accounts, credit cards, individual retirement accounts, mortgage loans and personal loans through its personal banking service. For its business clients it offers services such as commercial loans, cash management services and payroll processing. At year-end 2013, CNB had $140 million in assets up 6.1% from 2012. Like most small community banks in the US, CNB has a large loan portfolio and fewer investments. The bank is very reliant on loans as it largest source of income with a much smaller contribution coming from fees based services. In fact in 2013, revenues from loon sources was $7.9 million whilst fee income was $717,000. Evaluate the performance of Community National Bank using the data in Exhibit 3.2, 3.4 and 3.6. a. Calculate the following ratios for the bank in 2013: i. ROE ii. ROA iii. Equity Multiplier iv. Asset Utilisation (AU) v. Expense Ratio (ER) vi. Tax Ratio vii. Net Interest Margin viii. Burden Ans: See attached excel spreadsheet for 2013 answers b. Conduct a profitability analysis for the bank in 2013: ix. Do the profitability ratios for 2013 compare favourably to 2012? x. How do they compare to the following peer group figures for 2013? RATIO ROE ROA EM AU ER xii. Liquidity Risk: xiii. Operational Risk: xiv. Capital Adequacy: Ans: See attached spreadsheet TAX NIM EFFICIENCY BURDEN c. Calculate the following risk ratios: xi. Credit Risk: Peer Banks 9.58% 1.01% 9.49X 5.06% 3.79% Ans: Aggregate profitability for CNB is substantially higher measured both by both ROE and ROA. Because CNB has less equity relative to assets, it has greater financial leverage. Thus, the greater financial leverage increases CNB's ROE relative to peer banks. CNB has assumed a riskier profile with its greater financial leverage in that fewer assets can default before the bank is insolvent. CNB's ROA is higher because it eams a higher average yield on assets (AU), pays about the same in operating expense (ER), and significantly less in taxes (TAX = AU - ER-ROA). 0.26% 3.72% 70.36% 2.31% Allowance (Provision) for Loan Loss/Gross Loans Core Deposits/ Avg. Total Assets Efficiency Ratio Capital Base to total assets EXHIBIT 3.2 (continued) Balance Sheet ASSETS Loans: Real estate loans Commercial loans Individual loans Agricultural loans Other LN&LS in domestic off. LN&LS in foreign off. Loans held for sale Loans not held for sale Memo: Total loans Loan & Lease loss Allowance Net Loans & Leases Investments: U.S. Treasury & Agency securities Municipal securities Foreign debt securities All other securities Interest bearing bank balances Fed funds sold & resales Trading account assets Total Investments Total Earning Assets Nonint Cash & Due from banks Premises, fixed assets & capital leases Other real estate owned Dir & Indir Inv RE Ventures Investment in unconsolidated subs. Acceptances and other assets Total Assets Average Assets During Quarter % Cha 39.7 -3.8 -18.0 -9.0 0.0 0.0 0.0 12.3 12.3 23.1 12.2 -48.5 209.9 0.0 0.0 -66.0 0.0 0.0 -24.0 10.4 26.3 10.1 -11.9 0.0 0.0 -10.7 9.9 9.2 Dec-12 $ 1,000 62,214 12,685 3,813 37,085 0 0 115,797 115,797 782 115,015 2,487 1,593 0 0 16 0 0 4,096 119,111 5,023 2,642 303 0 0 4,975 132,054 129,754 Community National Bank % of Total 47.1 9.6 2.9 28.1 0.0 0.0 0.0 87.7 87.7 0.6 87.1 1.9 1.2 0.0 0.0 0.0 0.0 0.0 3.1 90.2 3.8 2.0 0.2 0.0 0.0 3.8 100.0 98.3 % Cha 2.9 9.5 -12.7 2.7 0.0 0.0 0.0 3.0 3.0 -9.0 3.1 -85.4 130.2 0.0 0.0 29506 0.0 0.0 114.1 6.9 -0.3 0.3 -79.5 0.0 0.0 1.6 6.1 6.0 Dec-13 $ 1,000 64,034 13,887 3,329 38,070 0 0 119,320 119,320 712 118,608 364 3,667 4,737 0 0 8,768 127,376 5,010 2,650 62 0 0 5,054 140,152 137,545 % of Total 45.7 9.9 2.4 27.2 0.0 0.0 0.0 85.1 85.1 0.5 84.6 0.3 2.6 0.0 0.0 3.4 0.0 0.0 6.3 90.9 3.6 1.9 0.0 0.0 0.0 3.6 100.0 98.1 EXHIBIT 3.2 (continued) Balance Sheet LIABILITIES Demand deposits All NOW & ATS Accounts Money market deposit accounts Other savings deposits Time Deps Below Insurance Limit Less: Fully Insured Brokered Deposits Core Deposits Fully Insured Brokered Deposits Time Deposits Above Insurance Limit Deposits held in foreign offices Total deposits Fed funds purchased & resale FHLB borrowings <1 Yr Other borrowings inc mat <1 yr Memo: Volatile liabilities FHLB borrowings >1 Yr Other borrowings inc mat >1 yr Acceptances & other liabilities Total Liabilities before Sub. Notes Sub. Notes & Debentures Total Liabilities TOTAL BANK EQUITY CAPITAL Minority Interest Cons Subs Total Bank Capital & Minority Int. Total Liabilities & Capital Memoranda: Officer, Shareholder Loans (#) Officer, Shareholder Loans ($) Held-to-Maturity Securities Available-for-Sale-Securities Total Securities % Cha 6.1 21.3 37.9 7.7 4.1 -6.2 12.2 -6.2 55.5 0.0 12.8 0.0 0.0 0.0 55.5 -100.0 #N/A -7.8 10.1 0.0 10.1 7.8 0.0 7.8 9.9 100.0 170.2 0.0 -23.6 -23.6 Dec-12 45.3 $ 1,000 21,901 14,610 18,441 8,480 50,645 5,166 108,911 5,166 6,159 0 120,236 0 0 0 6,159 0 1,000 367 121,603 0 121,603 10,451 0 10,451 132,054 2 2,915 0 4,080 4,080 8,003 Community National Bank % Cha 16.6 11.1 14.0 6.4 38.4 3.9 82.5 3.9 4.7 0.0 91.1 0.0 0.0 0.0 4.7 0.0 0.8 0.3 92.1 0.0 92.1 7.9 0.0 7.9 100.0 0.0 2.2 0.0 3.1 3.1 $ 1,000 6.1 9.9 -7.6 14.3 6.1 3.5 63.7 2.5 63.7 17.4 0.0 5.9 0.0 0.0 0.0 17.4 #N/A -100.0 -5.2 5.8 0.0 5.8 10.1 0.0 10.1 6.1 0.0 -6.8 0.0 -1.2 -1.2 47.4 Dec-13 % Cha 24,069 13,501 21,071 9,001 52,421 8,455 111,608 8,455 7,231 0 127,294 0 0 0 7,231 1,000 0 348 128,642 0 128,642 11,510 0 11,510 140,152 2 2,718 0 4,031 4,031 $ 1,000 11,794 17.2 9.6 15.0 6.4 37.4 6.0 79.6 6.0 5.2 0.0 90.8 0.0 0.0 0.0 5.2 0.7 0.0 0.2 91.8 0.0 91.8 All Brokered Deposits Source: Timothy Koch and S. Scott MacDonald; from FFIEC, Uniform Bank Performance Report, https://cdr.ffiec.gov/public/Manage 8.2 0.0 8.2 100.0 0.0 1.9 0.0 2.9 2.9 8.4 EXHIBIT 3.4 (continued) Income Statement Interest Income: Interest and fees on loans Income from lease financing Memo: Fully taxable Tax-exempt Estimated tax benefit Income on Loans & Leases (TE) U.S. Treasury & Agency securities Mortgage Backed Securities Estimated tax benefit All other securities income Tax-Exempt Securities Income Investment Interest Income (TE) Interest on due from banks Interest on Fed funds sold & resales Trading account income Other interest income Total interest income (TE) Interest Expense: Int on Deposits held in foreign offices Interest on CD's over $100M Interest on All Other Deposits: Total interest exp. on deposits Interest on Fed funds purchased & resale Interest on Trad Liab & Oth Borrowings Interest on Sub. Notes & Debentures Total interest expense Net interest income (TE) % Cha 5.3 0.0 5.4 -14.3 -20.0 5.3 #N/A -75.4 -100.0 82.4 -66.7 -37.3 -60.0 -100.0 0.0 166.7 5.1 0.0 -7.6 -23.4 -18.5 300.0 -71.9 0.0 -24.0 12.7 Dec-12 $ 1,000 6,926 0 6,914 12 4 6,930 2 14 0 31 1 47 2 0 0 48 7,027 0 352 647 999 4 41 0 1,044 5,983 Community National Bank % of Total 87.0 0.0 86.8 0.2 0.1 87.0 0.0 0.2 0.0 0.4 0.0 0.6 0.0 0.0 0.0 0.6 88.2 0.0 4.4 8.1 12.5 0.1 0.5 0.0 13.1 75.1 % Cha 14.1 0.0 14.2 -25.0 -25.0 14.1 -100.0 -28.6 #N/A 116.1 200.0 66.0 200.0 0.0 0.0 -58.3 14.0 0.0 -2.6 -18.7 -13.0 -100.0 -48.8 0.0 -14.8 19.0 Dec-13 $ 1,000 7,905 0 7,896 9 3 7,908 0 10 1 67 w 3 78 6 0 0 20 8,012 0 343 526 869 0 21 0 890 7,122 % of Total 90.5 0.0 90.4 0.1 0.0 90.6 0.0 0.1 0.0 0.8 0.0 0.9 0.1 0.0 0.0 0.2 91.8 0.0 3.9 6.0 10.0 0.0 0.2 0.0 10.2 81.6 EXHIBIT 3.4 (continued) Income Statement Noninterest Income: Fiduciary Activities Deposit service charges Trading rev, venture cap., securitize inc. Investment banking, advisory inc. Insurance commissions & fees Net servicing fees LN&LS net gains (losses) Other net gains (losses) Other noninterest income Total noninterest income Adjusted Operating Income (TE) Non-Interest Expenses: Personnel expense Occupancy expense Goodwill impairment Other Intangible Amortization Other Oper Exp (Incl intangibles) Total Noninterest Expenses Provision: Loan & Lease Losses Pretax Operating Income (TE) Realized G/L HId-to-Maturity Sec. Realized G/L Avail-for-Sale Sec. Pretax Net Operating Income (TE) Applicable Income Taxes Current Tax Equivalent Adjustment Other Tax Equivalent Adjustments Applicable Income Taxes (TE) Net Operating Income Net Extraordinary Items Net Inc Noncontrolling Minority Interests Net Income Cash Dividends Declared Retained Earnings % Cha 0.0 -13.5 0.0 0.0 #N/A 0.0 0.0 -53.1 -3.0 -5.8 9.7 18.8 1.4 0.0 0.0 5.5 12.0 -49.2 26.6 0.0 -105.8 20.8 0.0 -16.7 0.0 -16.7 21.0 0.0 0.0 21.0 72.6 -11.4 Dec-12 $ 1,000 0 660 0 0 3 6 0 (46) 318 941 6,924 2,901 567 0 0 1,763 5,231 254 1,439 0 (3) 1,436 0 5 0 5 1,431 0 0 1,431 787 644 Community National Bank % of Total 0.0 8.3 0.0 0.0 0.0 0.1 0.0 -0.6 4.0 11.8 86.9 36.4 7.1 0.0 0.0 22.1 65.7 3.2 18.1 0.0 0.0 18.0 0.0 0.1 0.0 0.1 18.0 0.0 0.0 18.0 9.9 8.1 0 % Cha 0.0 -19.1 0.0 0.0 -66.7 -16.7 0.0 132.6 -10.7 -23.8 13.2 11.9 29.1 0.0 0.0 -3.3 8.6 -58.7 42.7 0.0 -133.3 43.0 0.0 -20.0 0.0 -20.0 43.3 0.0 0.0 43.3 29.2 60.4 Dec-13 $ 1,000 0 534 0 0 1 5 0 (107) 284 717 7,839 3,245 732 0 0 1,704 5,681 105 2,053 0 1 2,054 0 4 0 4 2,050 0 0 2,050 1,017 1,033 % of Total 0.0 6.1 0.0 0.0 0.0 0.1 0.0 -1.2 3.3 8.2 89.8 37.2 8.4 0.0 0.0 19.5 65.1 1.2 23.5 0.0 0.0 23.5 0.0 0.0 0.0 0.0 23.5 0.0 0.0 23.5 11.6 11.8 Evaluate the performance of Community National Bank using the data in Exhibit 3.2, 3.4 and 3.6. Community National Bank (CNB) is a typical small independent bank located in the US state of North Carolina. CNB's main office is located in the metropolitan area of Charlotte and the bank has six branches and no nonbank subsidiaries. CNB services offers a personalised menu of financial services to individuals and businesses. This includes savings accounts, credit cards, individual retirement accounts, mortgage loans and personal loans through its personal banking service. For its business clients it offers services such as commercial loans, cash management services and payroll processing. At year-end 2013, CNB had $140 million in assets up 6.1% from 2012. Like most small community banks in the US, CNB has a large loan portfolio and fewer investments. The bank is very reliant on loans as it largest source of income with a much smaller contribution coming from fees based services. In fact in 2013, revenues from loon sources was $7.9 million whilst fee income was $717,000. Evaluate the performance of Community National Bank using the data in Exhibit 3.2, 3.4 and 3.6. a. Calculate the following ratios for the bank in 2013: i. ROE ii. ROA iii. Equity Multiplier iv. Asset Utilisation (AU) v. Expense Ratio (ER) vi. Tax Ratio vii. Net Interest Margin viii. Burden Ans: See attached excel spreadsheet for 2013 answers b. Conduct a profitability analysis for the bank in 2013: ix. Do the profitability ratios for 2013 compare favourably to 2012? x. How do they compare to the following peer group figures for 2013? RATIO ROE ROA EM AU ER xii. Liquidity Risk: xiii. Operational Risk: xiv. Capital Adequacy: Ans: See attached spreadsheet TAX NIM EFFICIENCY BURDEN c. Calculate the following risk ratios: xi. Credit Risk: Peer Banks 9.58% 1.01% 9.49X 5.06% 3.79% Ans: Aggregate profitability for CNB is substantially higher measured both by both ROE and ROA. Because CNB has less equity relative to assets, it has greater financial leverage. Thus, the greater financial leverage increases CNB's ROE relative to peer banks. CNB has assumed a riskier profile with its greater financial leverage in that fewer assets can default before the bank is insolvent. CNB's ROA is higher because it eams a higher average yield on assets (AU), pays about the same in operating expense (ER), and significantly less in taxes (TAX = AU - ER-ROA). 0.26% 3.72% 70.36% 2.31% Allowance (Provision) for Loan Loss/Gross Loans Core Deposits/ Avg. Total Assets Efficiency Ratio Capital Base to total assets EXHIBIT 3.2 (continued) Balance Sheet ASSETS Loans: Real estate loans Commercial loans Individual loans Agricultural loans Other LN&LS in domestic off. LN&LS in foreign off. Loans held for sale Loans not held for sale Memo: Total loans Loan & Lease loss Allowance Net Loans & Leases Investments: U.S. Treasury & Agency securities Municipal securities Foreign debt securities All other securities Interest bearing bank balances Fed funds sold & resales Trading account assets Total Investments Total Earning Assets Nonint Cash & Due from banks Premises, fixed assets & capital leases Other real estate owned Dir & Indir Inv RE Ventures Investment in unconsolidated subs. Acceptances and other assets Total Assets Average Assets During Quarter % Cha 39.7 -3.8 -18.0 -9.0 0.0 0.0 0.0 12.3 12.3 23.1 12.2 -48.5 209.9 0.0 0.0 -66.0 0.0 0.0 -24.0 10.4 26.3 10.1 -11.9 0.0 0.0 -10.7 9.9 9.2 Dec-12 $ 1,000 62,214 12,685 3,813 37,085 0 0 115,797 115,797 782 115,015 2,487 1,593 0 0 16 0 0 4,096 119,111 5,023 2,642 303 0 0 4,975 132,054 129,754 Community National Bank % of Total 47.1 9.6 2.9 28.1 0.0 0.0 0.0 87.7 87.7 0.6 87.1 1.9 1.2 0.0 0.0 0.0 0.0 0.0 3.1 90.2 3.8 2.0 0.2 0.0 0.0 3.8 100.0 98.3 % Cha 2.9 9.5 -12.7 2.7 0.0 0.0 0.0 3.0 3.0 -9.0 3.1 -85.4 130.2 0.0 0.0 29506 0.0 0.0 114.1 6.9 -0.3 0.3 -79.5 0.0 0.0 1.6 6.1 6.0 Dec-13 $ 1,000 64,034 13,887 3,329 38,070 0 0 119,320 119,320 712 118,608 364 3,667 4,737 0 0 8,768 127,376 5,010 2,650 62 0 0 5,054 140,152 137,545 % of Total 45.7 9.9 2.4 27.2 0.0 0.0 0.0 85.1 85.1 0.5 84.6 0.3 2.6 0.0 0.0 3.4 0.0 0.0 6.3 90.9 3.6 1.9 0.0 0.0 0.0 3.6 100.0 98.1 EXHIBIT 3.2 (continued) Balance Sheet LIABILITIES Demand deposits All NOW & ATS Accounts Money market deposit accounts Other savings deposits Time Deps Below Insurance Limit Less: Fully Insured Brokered Deposits Core Deposits Fully Insured Brokered Deposits Time Deposits Above Insurance Limit Deposits held in foreign offices Total deposits Fed funds purchased & resale FHLB borrowings <1 Yr Other borrowings inc mat <1 yr Memo: Volatile liabilities FHLB borrowings >1 Yr Other borrowings inc mat >1 yr Acceptances & other liabilities Total Liabilities before Sub. Notes Sub. Notes & Debentures Total Liabilities TOTAL BANK EQUITY CAPITAL Minority Interest Cons Subs Total Bank Capital & Minority Int. Total Liabilities & Capital Memoranda: Officer, Shareholder Loans (#) Officer, Shareholder Loans ($) Held-to-Maturity Securities Available-for-Sale-Securities Total Securities % Cha 6.1 21.3 37.9 7.7 4.1 -6.2 12.2 -6.2 55.5 0.0 12.8 0.0 0.0 0.0 55.5 -100.0 #N/A -7.8 10.1 0.0 10.1 7.8 0.0 7.8 9.9 100.0 170.2 0.0 -23.6 -23.6 Dec-12 45.3 $ 1,000 21,901 14,610 18,441 8,480 50,645 5,166 108,911 5,166 6,159 0 120,236 0 0 0 6,159 0 1,000 367 121,603 0 121,603 10,451 0 10,451 132,054 2 2,915 0 4,080 4,080 8,003 Community National Bank % Cha 16.6 11.1 14.0 6.4 38.4 3.9 82.5 3.9 4.7 0.0 91.1 0.0 0.0 0.0 4.7 0.0 0.8 0.3 92.1 0.0 92.1 7.9 0.0 7.9 100.0 0.0 2.2 0.0 3.1 3.1 $ 1,000 6.1 9.9 -7.6 14.3 6.1 3.5 63.7 2.5 63.7 17.4 0.0 5.9 0.0 0.0 0.0 17.4 #N/A -100.0 -5.2 5.8 0.0 5.8 10.1 0.0 10.1 6.1 0.0 -6.8 0.0 -1.2 -1.2 47.4 Dec-13 % Cha 24,069 13,501 21,071 9,001 52,421 8,455 111,608 8,455 7,231 0 127,294 0 0 0 7,231 1,000 0 348 128,642 0 128,642 11,510 0 11,510 140,152 2 2,718 0 4,031 4,031 $ 1,000 11,794 17.2 9.6 15.0 6.4 37.4 6.0 79.6 6.0 5.2 0.0 90.8 0.0 0.0 0.0 5.2 0.7 0.0 0.2 91.8 0.0 91.8 All Brokered Deposits Source: Timothy Koch and S. Scott MacDonald; from FFIEC, Uniform Bank Performance Report, https://cdr.ffiec.gov/public/Manage 8.2 0.0 8.2 100.0 0.0 1.9 0.0 2.9 2.9 8.4 EXHIBIT 3.4 (continued) Income Statement Interest Income: Interest and fees on loans Income from lease financing Memo: Fully taxable Tax-exempt Estimated tax benefit Income on Loans & Leases (TE) U.S. Treasury & Agency securities Mortgage Backed Securities Estimated tax benefit All other securities income Tax-Exempt Securities Income Investment Interest Income (TE) Interest on due from banks Interest on Fed funds sold & resales Trading account income Other interest income Total interest income (TE) Interest Expense: Int on Deposits held in foreign offices Interest on CD's over $100M Interest on All Other Deposits: Total interest exp. on deposits Interest on Fed funds purchased & resale Interest on Trad Liab & Oth Borrowings Interest on Sub. Notes & Debentures Total interest expense Net interest income (TE) % Cha 5.3 0.0 5.4 -14.3 -20.0 5.3 #N/A -75.4 -100.0 82.4 -66.7 -37.3 -60.0 -100.0 0.0 166.7 5.1 0.0 -7.6 -23.4 -18.5 300.0 -71.9 0.0 -24.0 12.7 Dec-12 $ 1,000 6,926 0 6,914 12 4 6,930 2 14 0 31 1 47 2 0 0 48 7,027 0 352 647 999 4 41 0 1,044 5,983 Community National Bank % of Total 87.0 0.0 86.8 0.2 0.1 87.0 0.0 0.2 0.0 0.4 0.0 0.6 0.0 0.0 0.0 0.6 88.2 0.0 4.4 8.1 12.5 0.1 0.5 0.0 13.1 75.1 % Cha 14.1 0.0 14.2 -25.0 -25.0 14.1 -100.0 -28.6 #N/A 116.1 200.0 66.0 200.0 0.0 0.0 -58.3 14.0 0.0 -2.6 -18.7 -13.0 -100.0 -48.8 0.0 -14.8 19.0 Dec-13 $ 1,000 7,905 0 7,896 9 3 7,908 0 10 1 67 w 3 78 6 0 0 20 8,012 0 343 526 869 0 21 0 890 7,122 % of Total 90.5 0.0 90.4 0.1 0.0 90.6 0.0 0.1 0.0 0.8 0.0 0.9 0.1 0.0 0.0 0.2 91.8 0.0 3.9 6.0 10.0 0.0 0.2 0.0 10.2 81.6 EXHIBIT 3.4 (continued) Income Statement Noninterest Income: Fiduciary Activities Deposit service charges Trading rev, venture cap., securitize inc. Investment banking, advisory inc. Insurance commissions & fees Net servicing fees LN&LS net gains (losses) Other net gains (losses) Other noninterest income Total noninterest income Adjusted Operating Income (TE) Non-Interest Expenses: Personnel expense Occupancy expense Goodwill impairment Other Intangible Amortization Other Oper Exp (Incl intangibles) Total Noninterest Expenses Provision: Loan & Lease Losses Pretax Operating Income (TE) Realized G/L HId-to-Maturity Sec. Realized G/L Avail-for-Sale Sec. Pretax Net Operating Income (TE) Applicable Income Taxes Current Tax Equivalent Adjustment Other Tax Equivalent Adjustments Applicable Income Taxes (TE) Net Operating Income Net Extraordinary Items Net Inc Noncontrolling Minority Interests Net Income Cash Dividends Declared Retained Earnings % Cha 0.0 -13.5 0.0 0.0 #N/A 0.0 0.0 -53.1 -3.0 -5.8 9.7 18.8 1.4 0.0 0.0 5.5 12.0 -49.2 26.6 0.0 -105.8 20.8 0.0 -16.7 0.0 -16.7 21.0 0.0 0.0 21.0 72.6 -11.4 Dec-12 $ 1,000 0 660 0 0 3 6 0 (46) 318 941 6,924 2,901 567 0 0 1,763 5,231 254 1,439 0 (3) 1,436 0 5 0 5 1,431 0 0 1,431 787 644 Community National Bank % of Total 0.0 8.3 0.0 0.0 0.0 0.1 0.0 -0.6 4.0 11.8 86.9 36.4 7.1 0.0 0.0 22.1 65.7 3.2 18.1 0.0 0.0 18.0 0.0 0.1 0.0 0.1 18.0 0.0 0.0 18.0 9.9 8.1 0 % Cha 0.0 -19.1 0.0 0.0 -66.7 -16.7 0.0 132.6 -10.7 -23.8 13.2 11.9 29.1 0.0 0.0 -3.3 8.6 -58.7 42.7 0.0 -133.3 43.0 0.0 -20.0 0.0 -20.0 43.3 0.0 0.0 43.3 29.2 60.4 Dec-13 $ 1,000 0 534 0 0 1 5 0 (107) 284 717 7,839 3,245 732 0 0 1,704 5,681 105 2,053 0 1 2,054 0 4 0 4 2,050 0 0 2,050 1,017 1,033 % of Total 0.0 6.1 0.0 0.0 0.0 0.1 0.0 -1.2 3.3 8.2 89.8 37.2 8.4 0.0 0.0 19.5 65.1 1.2 23.5 0.0 0.0 23.5 0.0 0.0 0.0 0.0 23.5 0.0 0.0 23.5 11.6 11.8
Expert Answer:
Answer rating: 100% (QA)
ANSWER Here is the analysis of the performance of Community National Bank CNB using the data provided in Exhibits 32 34 and 36 a Calculation of ratios for 2013 i ROE Return on Equity Net Income Averag... View the full answer

Related Book For 

Posted Date:
Students also viewed these banking questions
-
R and R patented this process with the 'Baby Boomer' generation in mind. This is the demographic of the population between the ages of 57 and 75. They are the market that is most likely to place an...
-
CHOOSE THE CORRECT ANSWER: 1. If R & S is true, then which of the following is correct? A. R is true. B. R is false. C. R could be true or false. 2. If R & S is false, then which of the...
-
R = 5 with probability 0.25, R = 0.25 with probability 0.25, R = 1 with probability 0.5. Find the arithmetic and geometric means of the random variables R for per capita production in the above...
-
Two bars AB and BC of negligible weight are attached to a single spring of constant k that is unstretched when the bars are horizontal. Determine the range of values of the magnitude P of two equal...
-
Identify and describe a great manager. What makes him or her stand out from the crowd?
-
a) Discuss how your attitude to power and authority would differ from that of your team members. How flexible would you be to adapt to the teams expectations based on their cultural diversity? b)...
-
The organisation maintains a three-column cash book. It submits the details of following cash/bank transactions for the month of May 20CY. Please record them in the three column cash book. Date...
-
On April 10, 2017, fire damaged the office and warehouse of Corvet Company. Most of the accounting records were destroyed, but the following account balances were determined as of March 31, 2017:...
-
Prepare Phillip and Claire's 2022 Federal Tax Return, and fill out the following forms: Form 1040, Schedule 1, Schedule 2, Schedule A, B, C, D, SE, Form 8949, Form 8995 TAXPAYER INFORMATION 1....
-
Cinder Inc. is a Canadian-controlled private corporation based in your province. The company operates a wholesale business. The following information is provided for its year ended May 31, 2020: 1....
-
Compute the distance vector at Node C and D during the round T=1 in the example of the Distance-Vector routing algorithm in the lecture note. Show the process of updating each value in the distance...
-
Explain how job satisfaction can impact employee productivity and absenteeism
-
QUESTION 3: ACCOUNTING FOR INCOME TAX The accounting profit after tax for Colesworths Ltd for the year ended 30 June 2023 was $2,089,500 and included the following revenue and expense items:...
-
Write briefly the significance of mitosis and meiosis in multicellular organism.
-
Jet Skis Galore projects unit sales for a new jet skis as follows: Year Unit Sales 1 250 2 300 3 400 4 600 Total fixed costs are $75,000 per year, variable production costs are $500 per...
-
Simple Leveraged Buyout Model The core idea of a leveraged buyout model can be boiled down to one page Step 1 - Buy the Company (Transaction Sources & Uses) EBITDA x Multiple Assumed Leverage Uses of...
-
The private address of the host computer is 192.168.112.100 and the destination address is 170.116.12.53. The valid address from the NAT service is 218.248.130.47. Out In to the Internet Direction...
-
Show that if A is any m n matrix, then Im A = A and AIn = A.
-
Canada Post is a Crown corporation with the dual mandate of providing a public service and maximizing profits. With 50,000 employees, Canada Post delivers over 9 billion letters and parcels annually....
-
Hinton Property Management Company (HPMC) owns several properties that it rents to major hotel chains such as The Westin and Holiday Inn. HPMC does not operate the hotels but instead simply provides...
-
List and briefly describe the purpose of each of the five steps involved in the revenue recognition process.
-
The following are summaries of the cash book and bank accounts of J. Duncan who does not keep his books using the double entry system. You are required to: (a) Calculate the value of J. Duncan's...
-
Read the following and answer the questions below. On 31 December 2015 the bank column of C. Tench's cash book showed a debit balance of 1,500. The monthly bank statement written up to 31 December...
-
The bank columns in the cash book for June 2016 and the bank statement for that month for D. Hogan are as follows: You are required to: () Write the cash book up to date to take the above into...

Study smarter with the SolutionInn App