

Question: (Evaluating Reports MC) A set of data is represented in the stem plot below. 345 6 5 2 6 1 7 8 7 4
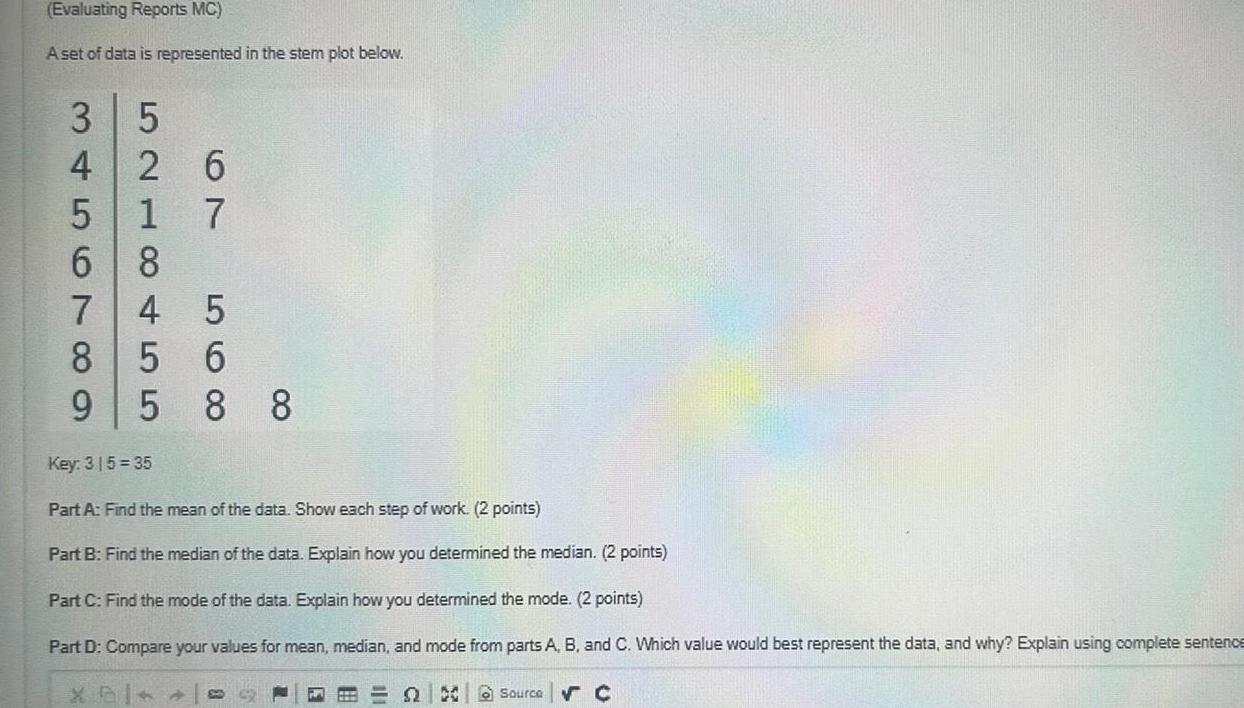
(Evaluating Reports MC) A set of data is represented in the stem plot below. 345 6 5 2 6 1 7 8 7 4 5 8 88 56 9 5 8 8 Key: 315=35 Part A: Find the mean of the data. Show each step of work. (2 points) Part B: Find the median of the data. Explain how you determined the median. (2 points) Part C: Find the mode of the data. Explain how you determined the mode. (2 points) Part D: Compare your values for mean, median, and mode from parts A, B, and C. Which value would best represent the data, and why? Explain using complete sentence Source C
Step by Step Solution
There are 3 Steps involved in it
1 Expert Approved Answer
Step: 1 Unlock

Question Has Been Solved by an Expert!
Get step-by-step solutions from verified subject matter experts
Step: 2 Unlock
Step: 3 Unlock