

Question: Ex . 1 5 - 2 5 : Graphical Analysis - - Variable Overhead Cost Variances You are in charge of making a presentation to
Ex: Graphical AnalysisVariable Overhead Cost Variances
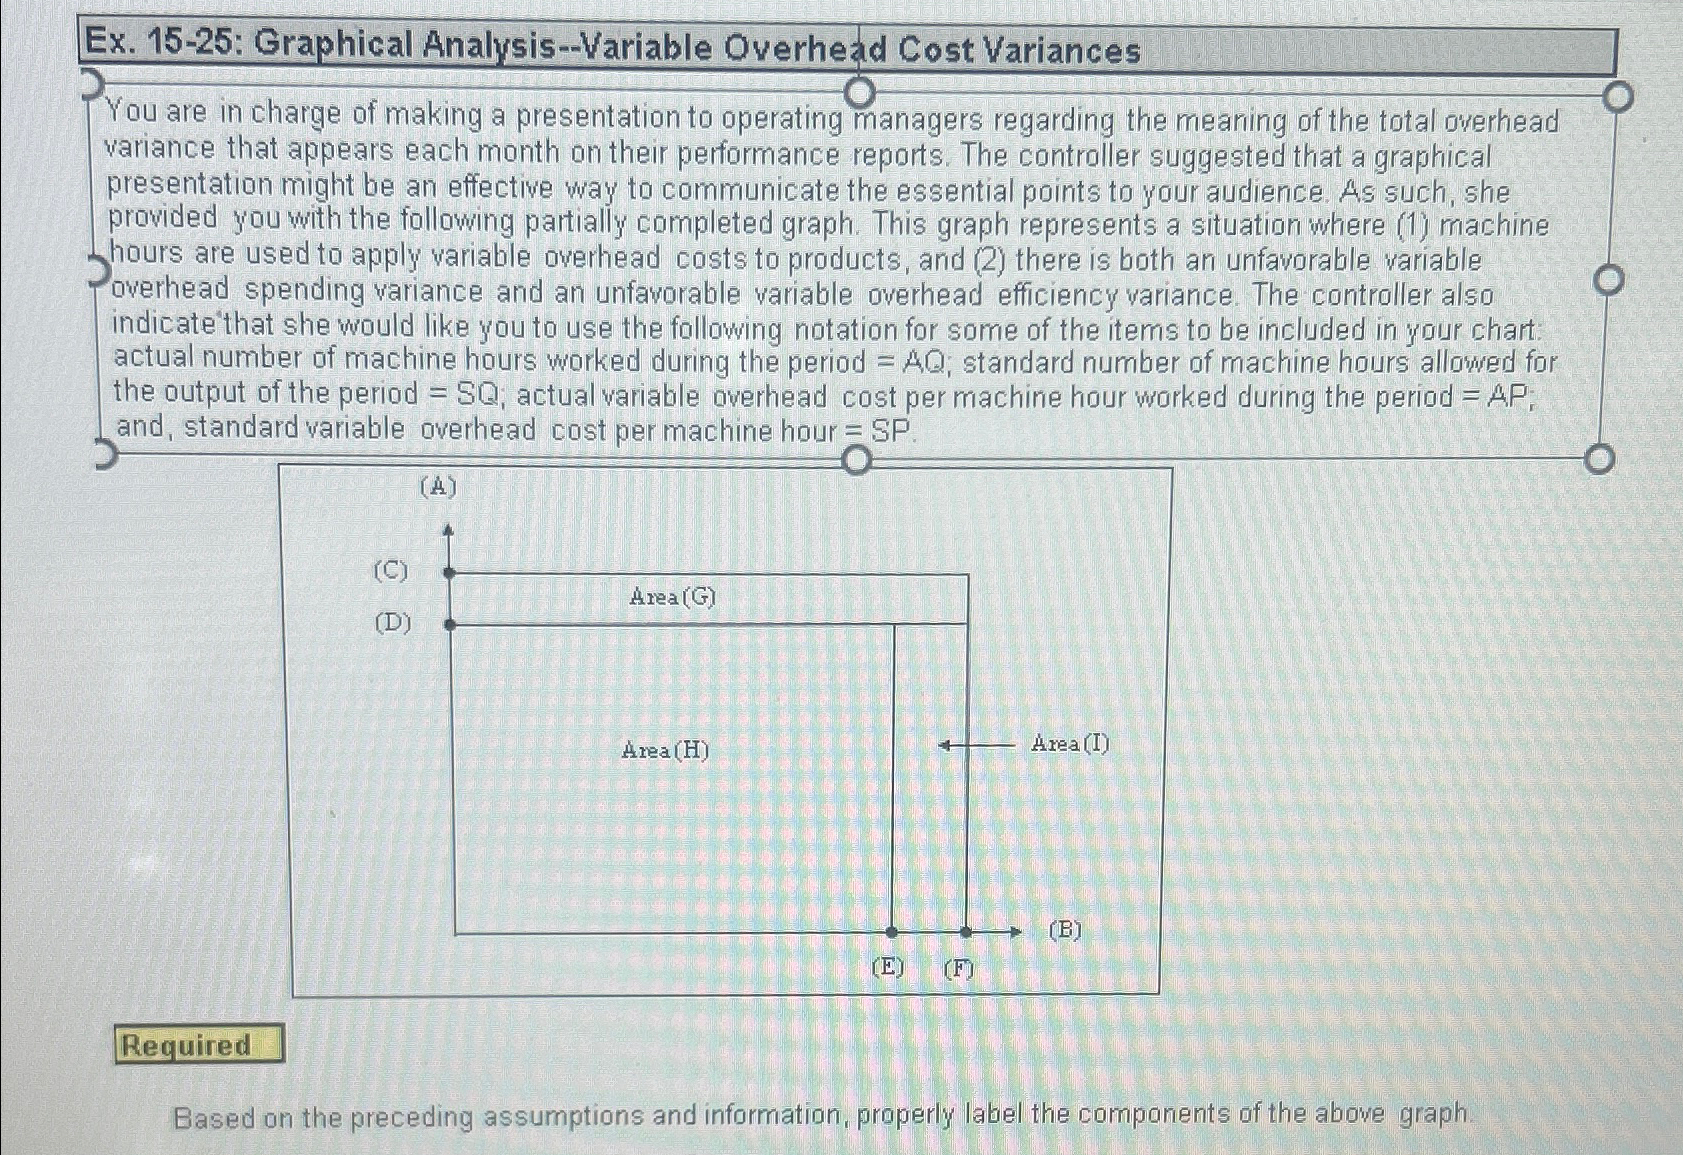
You are in charge of making a presentation to operating managers regarding the mearing of the total overhead variance that appears each month on their performance reports. The controller suggested that a graphical presentation might be an effective way to communicate the essential points to your audience. As such, she provided you with the following partially completed graph. This graph represents a situation where machine hours are used to apply variable overhead costs to products, and there is both an unfavorable variable overhead spending variance and an unfavorable variable overhead efficiency variance. The controller also indicate that she would like you to use the following notation for some of the items to be included in your chart: actual number of machine hours worked during the period ; standard number of machine hours allowed for the output of the period SQ; actual variable overhead cost per machine hour worked during the period AP: and, standard variable overhead cost per machine hour
Based on the preceding assumptions and information, properly label the components of the above graph.
Step by Step Solution
There are 3 Steps involved in it
1 Expert Approved Answer
Step: 1 Unlock

Question Has Been Solved by an Expert!
Get step-by-step solutions from verified subject matter experts
Step: 2 Unlock
Step: 3 Unlock