

Question: ## Ex18: Plotly-TimeSeries ## Objective: Use Python to create a time series chart that displays the stock prices of IBM, Google and Airbnb for
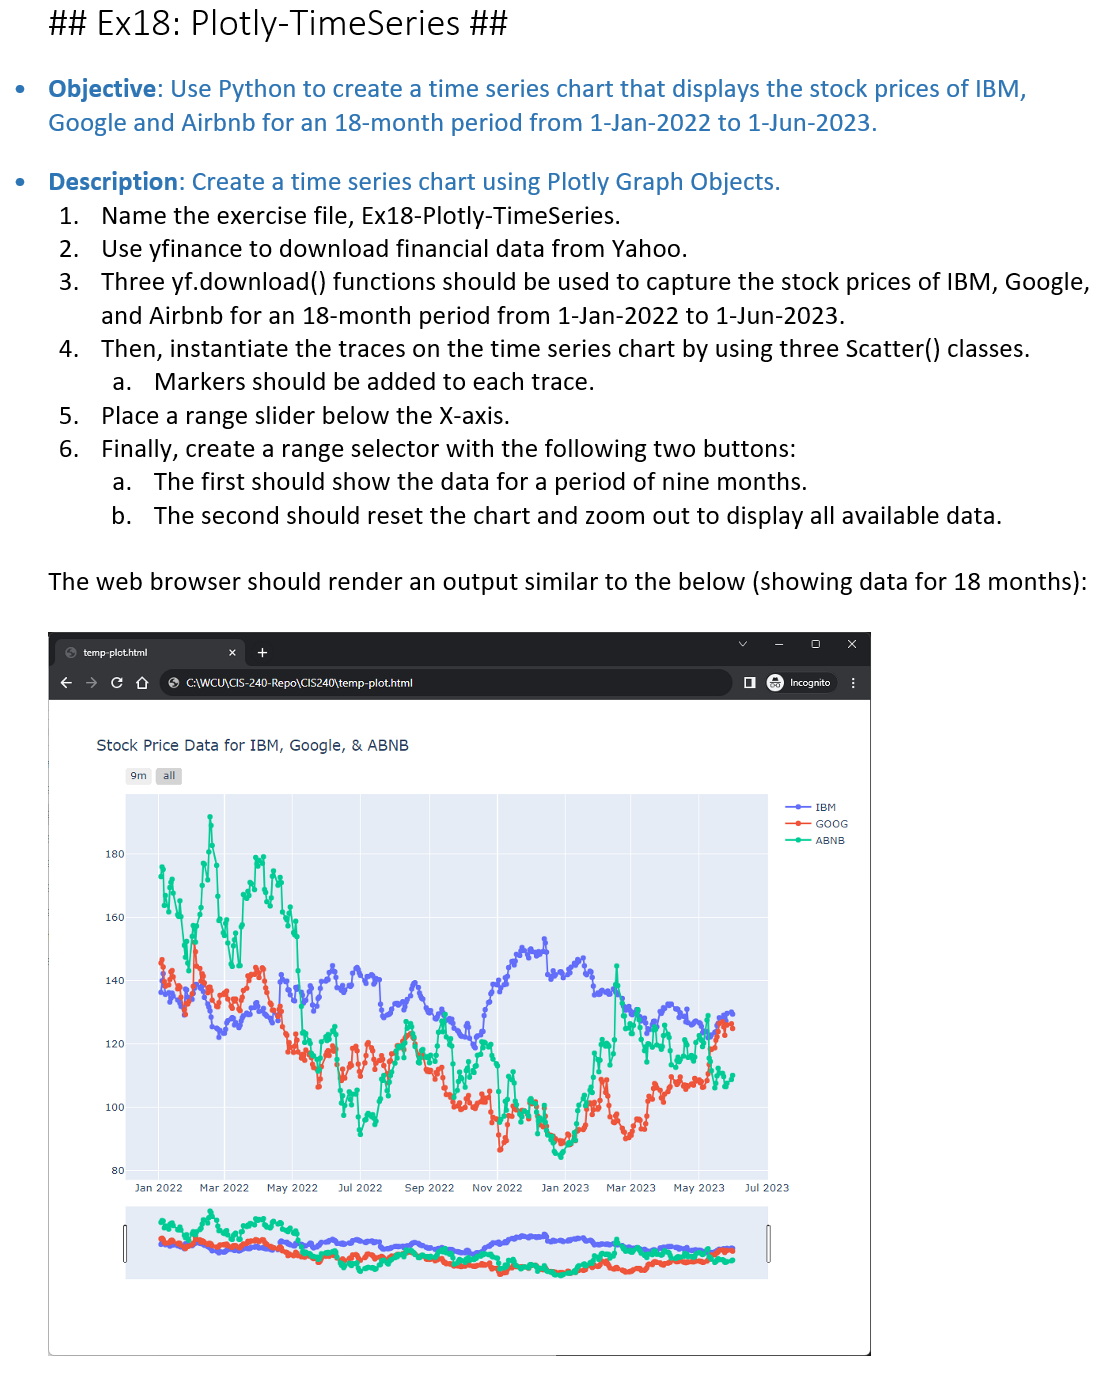
## Ex18: Plotly-TimeSeries ## Objective: Use Python to create a time series chart that displays the stock prices of IBM, Google and Airbnb for an 18-month period from 1-Jan-2022 to 1-Jun-2023. Description: Create a time series chart using Plotly Graph Objects. 1. Name the exercise file, Ex18-Plotly-TimeSeries. 2. Use yfinance to download financial data from Yahoo. 3. Three yf.download() functions should be used to capture the stock prices of IBM, Google, and Airbnb for an 18-month period from 1-Jan-2022 to 1-Jun-2023. 4. Then, instantiate the traces on the time series chart by using three Scatter() classes. a. Markers should be added to each trace. 5. Place a range slider below the X-axis. 6. Finally, create a range selector with the following two buttons: a. The first should show the data for a period of nine months. b. The second should reset the chart and zoom out to display all available data. The web browser should render an output similar to the below (showing data for 18 months): > temp-plot.html CD Stock Price Data for IBM, Google, & ABNB 180 160 140 120 100 80 C:\WCU\CIS-240-Repo\CIS240\temp-plot.html 9m all Jan 2022 Mar 2022 May 2022 Jul 2022 Sep 2022 Nov 2022 Jan 2023 Mar 2023 May 2023 Incognito - IBM -GOOG -ABNB Jul 2023
Step by Step Solution
3.32 Rating (164 Votes )
There are 3 Steps involved in it
To create a time series chart using Plotly Graph Objects you can follow the steps outlined below Ins... View full answer

Get step-by-step solutions from verified subject matter experts