

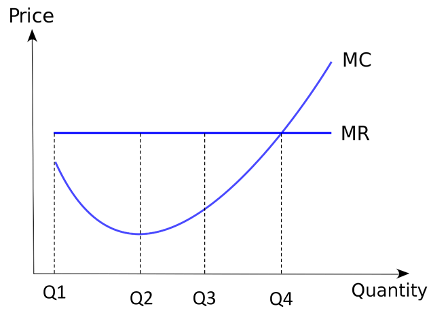
Examine the following chart involving marginal cost (MC) and marginal revenue. A producer needs to decide what
Fantastic news! We've Found the answer you've been seeking!
Question:
Examine the following chart involving marginal cost (MC) and marginal revenue. A producer needs to decide what level of output she/he should produce in order to maximize total dollars of profitability. There are four possible levels of output: Q1, Q2, Q3, or Q4. Interpret the chart and explain what the optimal level of output (i.e., Q1, 2, etc.) would be and why. (10 points)
Expert Answer:

Related Book For 
Managerial economics applications strategy and tactics
ISBN: 978-1439079232
12th Edition
Authors: James r. mcguigan, R. Charles Moyer, frederick h. deb harris
Posted Date:
