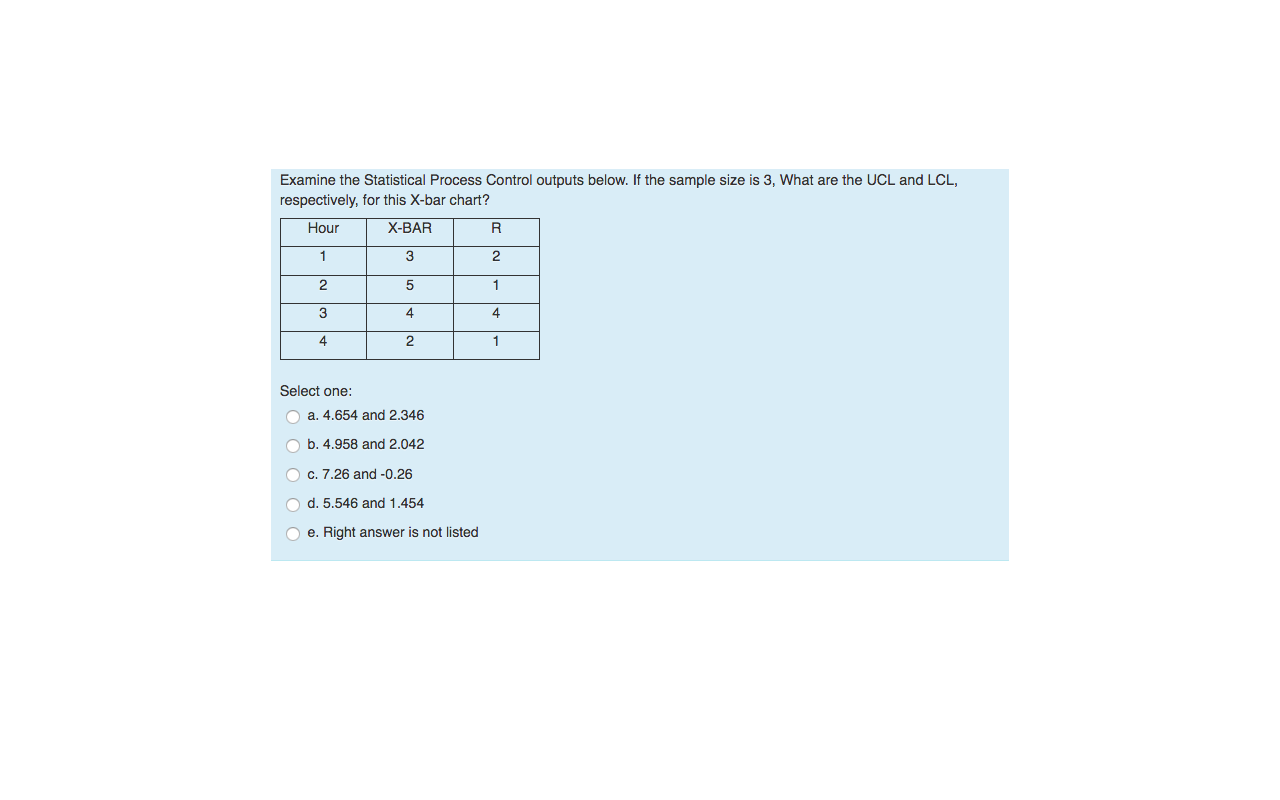
Question: Examine the Statistical Process Control outputs below. If the sample size is 3, What are the UCL and LCL, respectively, for this X-bar chart? Hour

Examine the Statistical Process Control outputs

Examine the Statistical Process Control outputs below. If the sample size is 3, What are the UCL and LCL, respectively, for this X-bar chart? Hour X-BAR R 1 3 2 2 5 1 3 4 4 4 2 1 Select one: O a. 4.654 and 2.346 O b. 4.958 and 2.042 O c. 7.26 and -0.26 O d. 5.546 and 1.454 e. Right answer is not listed

Step by Step Solution

There are 3 Steps involved in it

1 Expert Approved Answer
Step: 1 Unlock blur-text-image
Question Has Been Solved by an Expert!

Get step-by-step solutions from verified subject matter experts

Step: 2 Unlock
Step: 3 Unlock

Students Have Also Explored These Related General Management Questions!