

Question: Examine the table below. Compute the overall evaluation scores for Brands 1 through 3 . Which of the three brands is the most likely brand
Examine the table below. Compute the overall evaluation scores for Brands through Which of the three brands is the most likely brand to be selected?
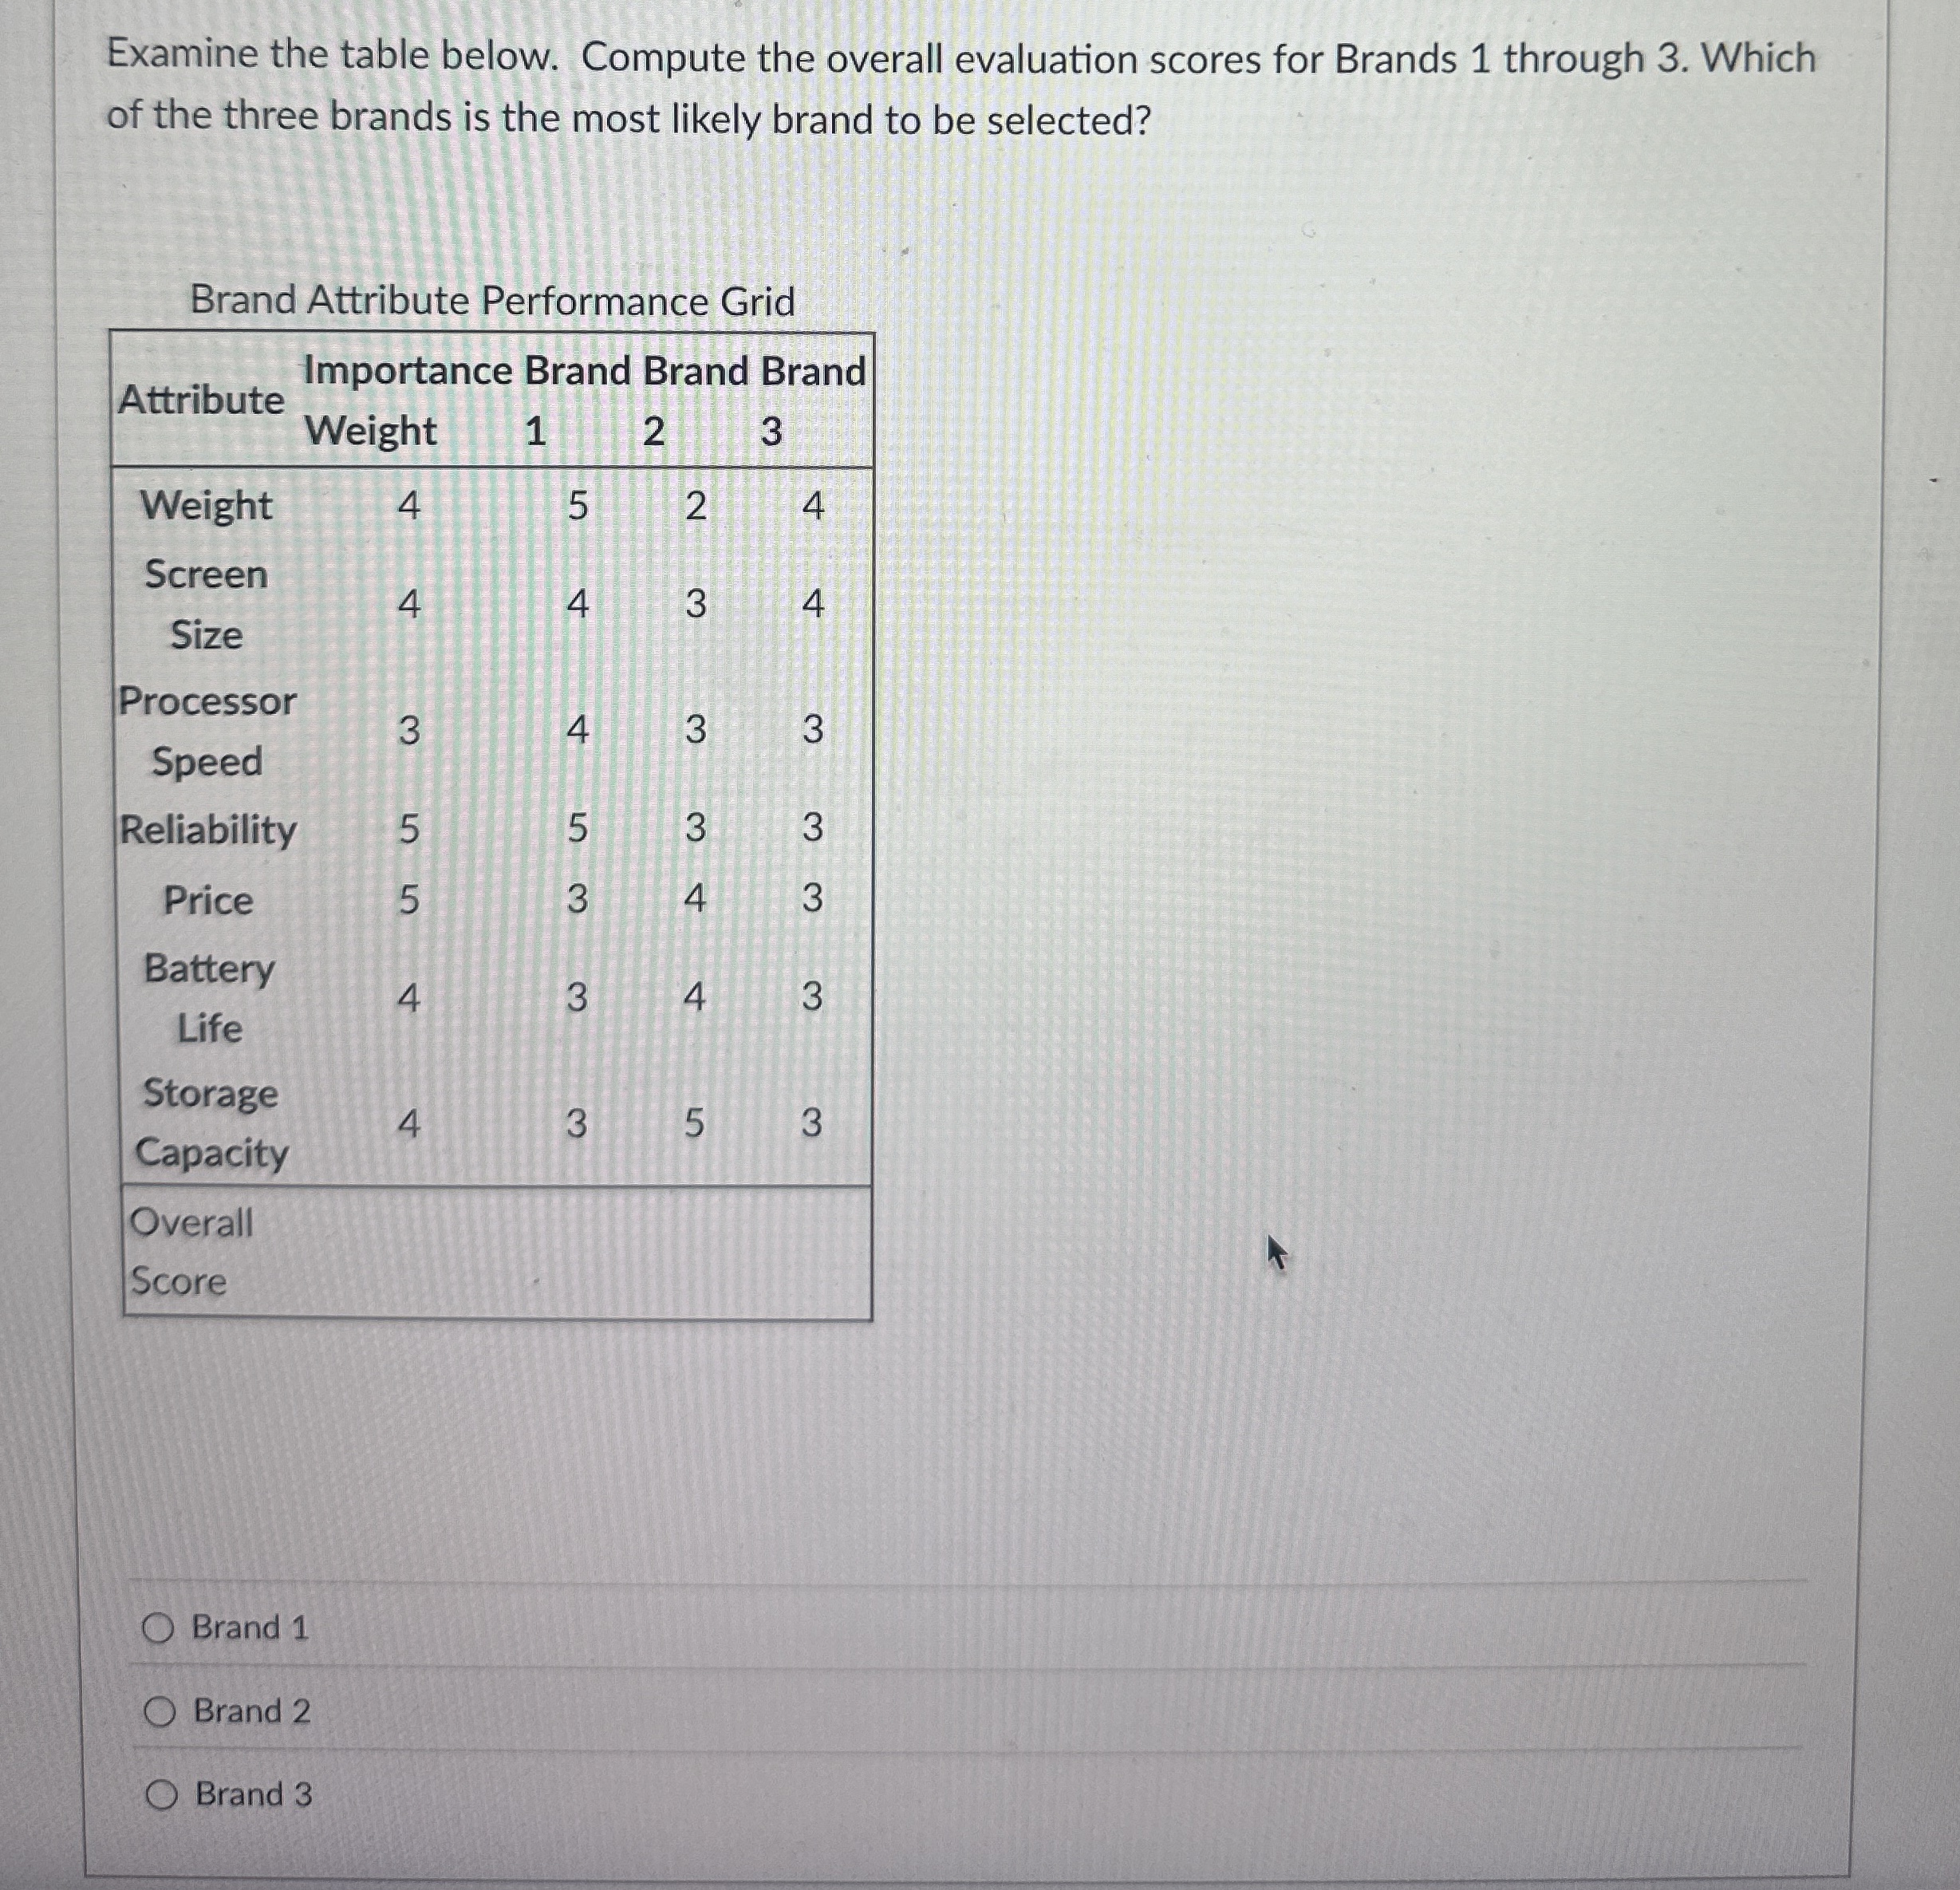
Brand Attribute Performance Grid
tableAttributeImportance Brand Brand BrandWeightWeighttableScreenSizetableProcessorSpeedReliabilityPricetableBatteryLifetableStorageCapacitytableOverallScore
Brand
Brand
Brand
Step by Step Solution
There are 3 Steps involved in it
1 Expert Approved Answer
Step: 1 Unlock

Question Has Been Solved by an Expert!
Get step-by-step solutions from verified subject matter experts
Step: 2 Unlock
Step: 3 Unlock