

Question: Example 1: Pick a Number: 1, 2, 3, or 4 Some kids did an experiment, going around and asking folks to randomly pick a number
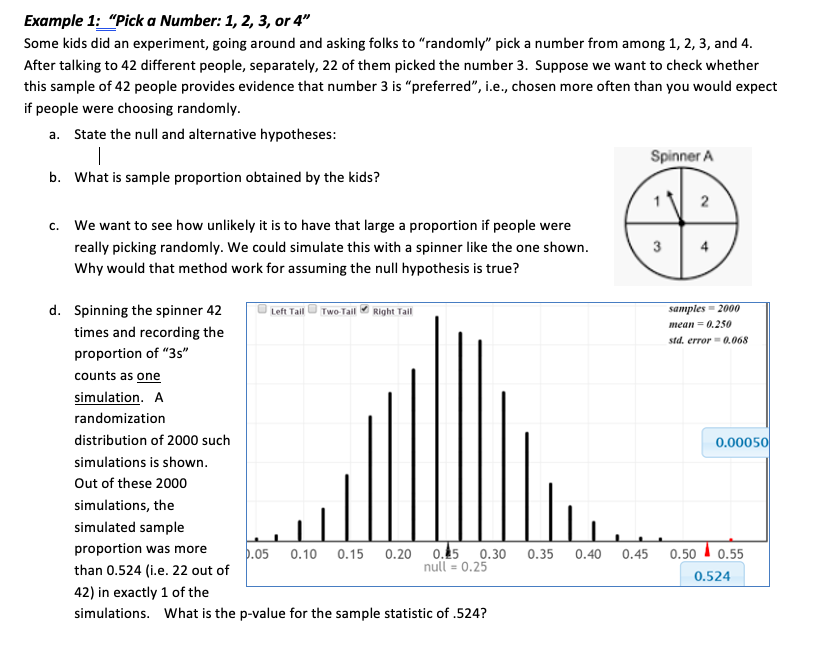
Example 1: "Pick a Number: 1, 2, 3, or 4" Some kids did an experiment, going around and asking folks to "randomly" pick a number from among 1, 2, 3, and 4. After talking to 42 different people, separately, 22 of them picked the number 3. Suppose we want to check whether this sample of 42 people provides evidence that number 3 is "preferred", i.e., chosen more often than you would expect if people were choosing randomly. a. State the null and alternative hypotheses: Spinner A b. What is sample proportion obtained by the kids? c. We want to see how unlikely it is to have that large a proportion if people were really picking randomly. We could simulate this with a spinner like the one shown. Why would that method work for assuming the null hypothesis is true? d. Spinning the spinner 42 Left Tall Two-Tall Right Tall samples = 2000 times and recording the mean = 0.250 sid. error = 0.068 proportion of "3s" counts as one simulation. A randomization distribution of 2000 such 0.00050 simulations is shown. Out of these 2000 simulations, the simulated sample proportion was more p.05 0.10 0.15 0.20 0.45 0.30 0.35 0.40 0.45 0.50 0.55 than 0.524 (i.e. 22 out of null = 0.25 0.524 42) in exactly 1 of the simulations. What is the p-value for the sample statistic of .524
Step by Step Solution
There are 3 Steps involved in it

Get step-by-step solutions from verified subject matter experts