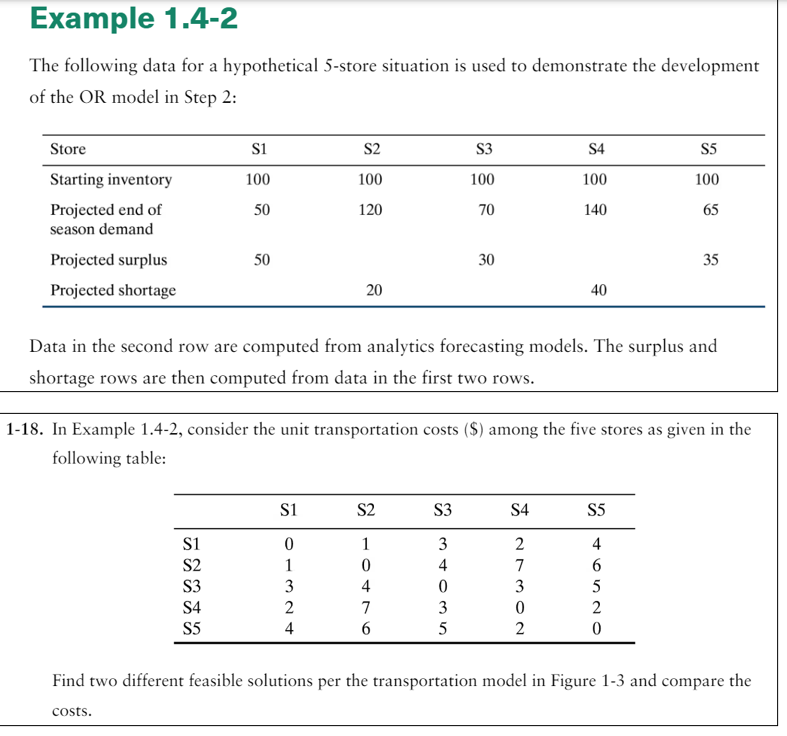
Question: Example 1.4-2 The following data for a hypothetical 5-store situation is used to demonstrate the development of the OR model in Step 2: Store S1

Example 1.4-2 The following data for a
Example 1.4-2 The following data for a hypothetical 5-store situation is used to demonstrate the development of the OR model in Step 2: Store S1 S2 S3 S4 S5 Starting inventory 100 100 100 100 100 Projected end of 50 120 70 140 65 season demand Projected surplus 50 30 35 Projected shortage 20 40 Data in the second row are computed from analytics forecasting models. The surplus and shortage rows are then computed from data in the first two rows. 1-18. In Example 1.4-2, consider the unit transportation costs ($) among the five stores as given in the following table: S1 S2 53 S4 S5 S1 0 1 3 2 4 S2 1 0 4 7 6 S3 3 4 0 3 5 S4 2 7 3 0 2 S5 4 6 5 2 0 Find two different feasible solutions per the transportation model in Figure 1-3 and compare the COSIS

Step by Step Solution

There are 3 Steps involved in it

1 Expert Approved Answer
Step: 1 Unlock blur-text-image
Question Has Been Solved by an Expert!

Get step-by-step solutions from verified subject matter experts

Step: 2 Unlock
Step: 3 Unlock

Students Have Also Explored These Related General Management Questions!