

Question: Repeat Problem 1-18 using the same cost table and the following raw data: Problem 1-18 In Example 1.4-2, consider the unit transportation costs ($) among
Repeat Problem 1-18 using the same cost table and the following raw data: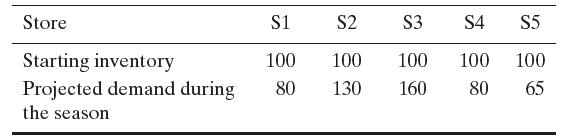
Problem 1-18
In Example 1.4-2, consider the unit transportation costs ($) among the five stores as given in the following table: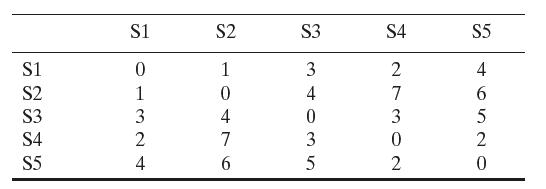
Find two different feasible solutions per the transportation model in Figure 1-3 and compare the costs.
Example 1.4-2
The following data for a hypothetical 5-store situation is used to demonstrate the development of the OR model in Step 2: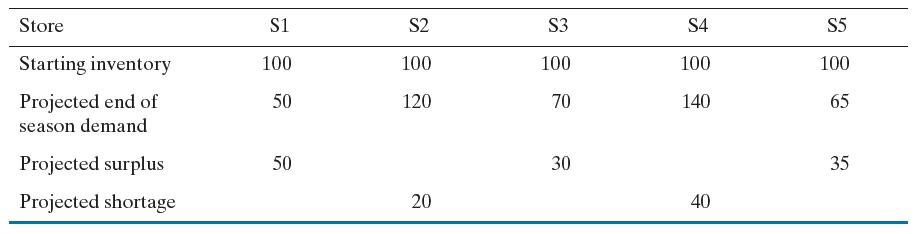
Data in the second row are computed from analytics forecasting models. The surplus and shortage rows are then computed from data in the first two rows.
Figure 1.3 summarizes the resulting transportation model. Stores 1, 3, and 5 are shipping sources, whereas stores 2 and 4 are the receiving destinations. The arrows between the sources and the destinations represent possible delivery routes, with each route dictating a specific transportation cost per transported unit. A source may distribute its supply amount among multiple destinations and a destination may fulfill its demand from multiple sources. Either way, the selected delivery schedule is optimum, as explained in Section 5.3 (Chapter 5).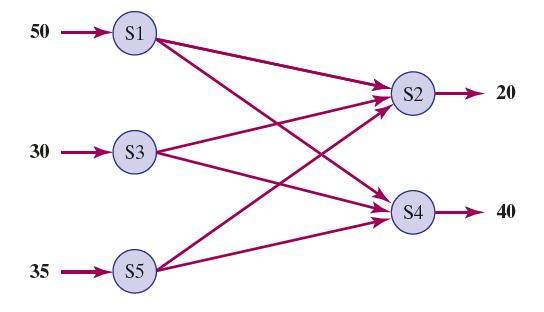
Store Starting inventory Projected demand during the season S1 S2 100 100 80 130 S3 S4 S5 100 100 100 160 80 65
Step by Step Solution
3.31 Rating (163 Votes )
There are 3 Steps involved in it
Solution 1 not underlined S4S110 S4S220 S5S210 S4S320 S5S325 Shortage at S315 Cos... View full answer

Get step-by-step solutions from verified subject matter experts