

Question: EXAMPLE 2 . 6 For the precipitation data arranged for different durations in Table 2 . 6 , prepare intensity - duration - frequency curves
EXAMPLE
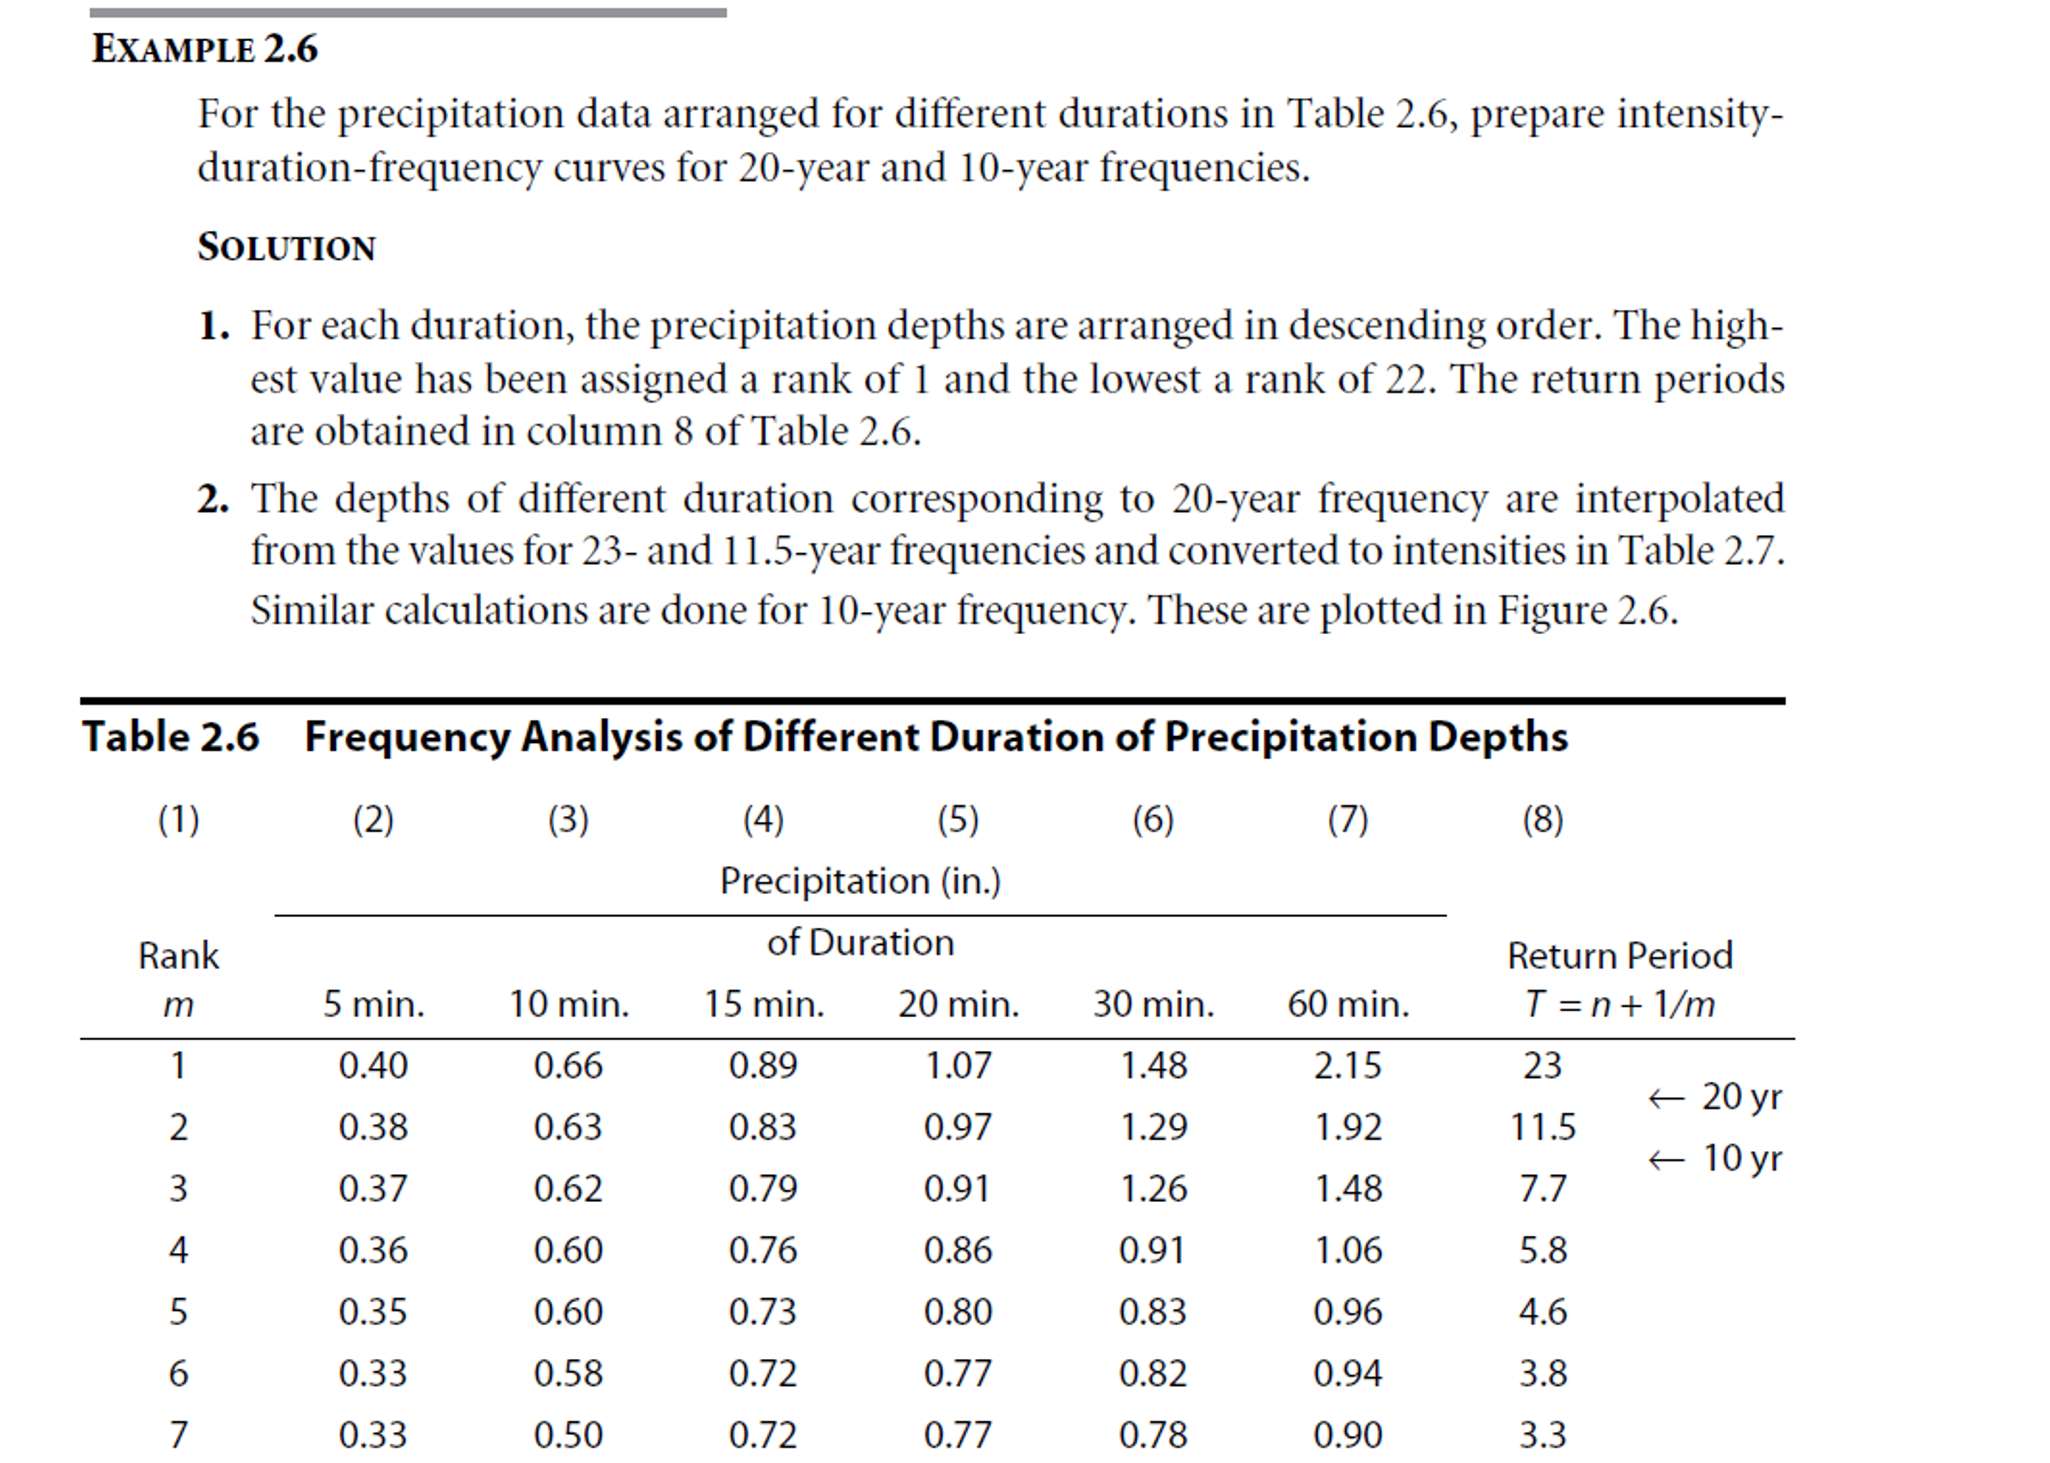
For the precipitation data arranged for different durations in Table prepare intensity
durationfrequency curves for year and year frequencies.
Solution
For each duration, the precipitation depths are arranged in descending order. The high
est value has been assigned a rank of and the lowest a rank of The return periods
are obtained in column of Table
The depths of different duration corresponding to year frequency are interpolated
from the values for and year frequencies and converted to intensities in Table
Similar calculations are done for year frequency. These are plotted in Figure
Table Frequency Analysis of Different Duration of Precipitation Depths
Step by Step Solution
There are 3 Steps involved in it
1 Expert Approved Answer
Step: 1 Unlock

Question Has Been Solved by an Expert!
Get step-by-step solutions from verified subject matter experts
Step: 2 Unlock
Step: 3 Unlock