

Question: Example 2 . 6 ( Gupta ) : Construction Intensity - Duration - Frequency Curves For the precipitation data arranged for different durations in Table
Example Gupta: Construction
IntensityDurationFrequency Curves
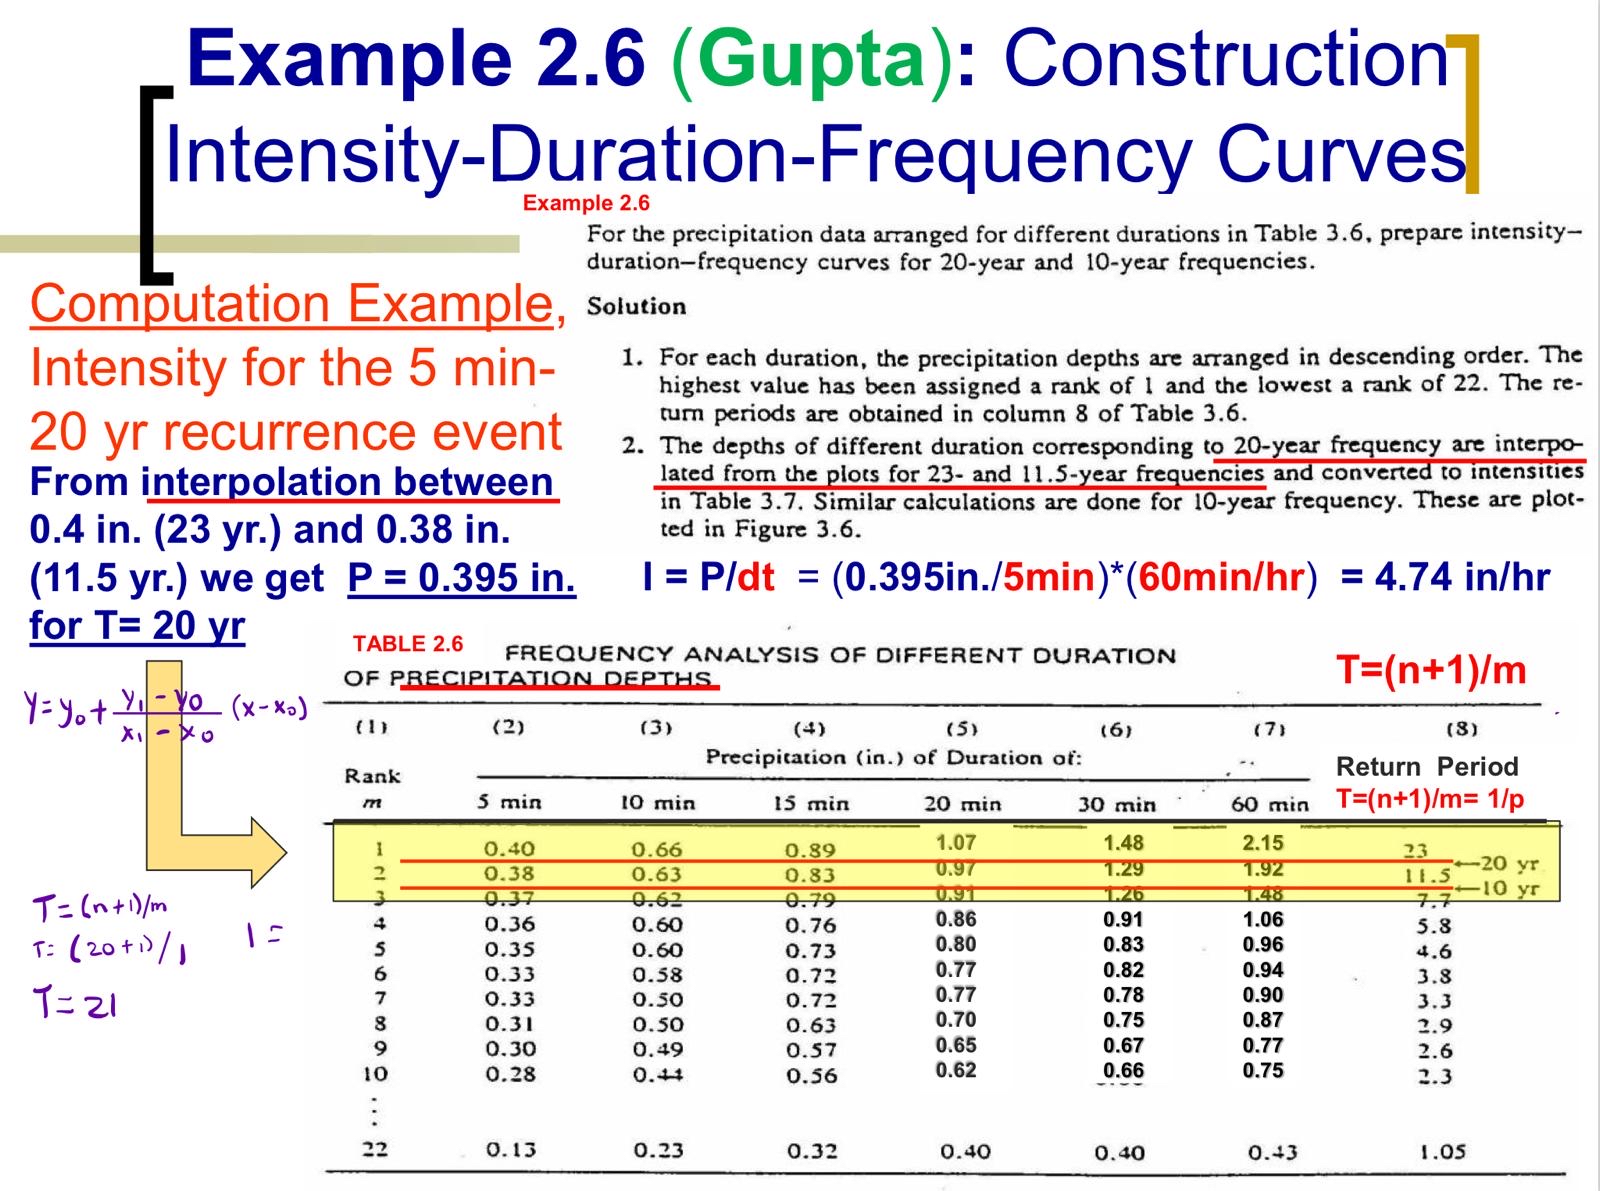
For the precipitation data arranged for different durations in Table prepare intensity
durationfrequency curves for year and year frequencies.
Computation Example, solution
Intensity for the min
yr recurrence event
For each duration, the precipitation depths are arranged in descending order. The
highest value has been assigned a rank of and the lowest a rank of The re
turn periods are obtained in column of Table
The depths of different duration corresponding to year frequency are interpo
From interpolation between
in yr and in
lated from the plots for and year frequencies and converted to intensities
in Table Similar calculations are done for year frequency. These are plot
ted in Figure
yr we get
Pdt minhr
Step by Step Solution
There are 3 Steps involved in it
1 Expert Approved Answer
Step: 1 Unlock

Question Has Been Solved by an Expert!
Get step-by-step solutions from verified subject matter experts
Step: 2 Unlock
Step: 3 Unlock