

Question: Example 3: Scenario Analysis Scenario analysis is used to determine the range of possible outcomes for a project. Typically, the base case, best case, and
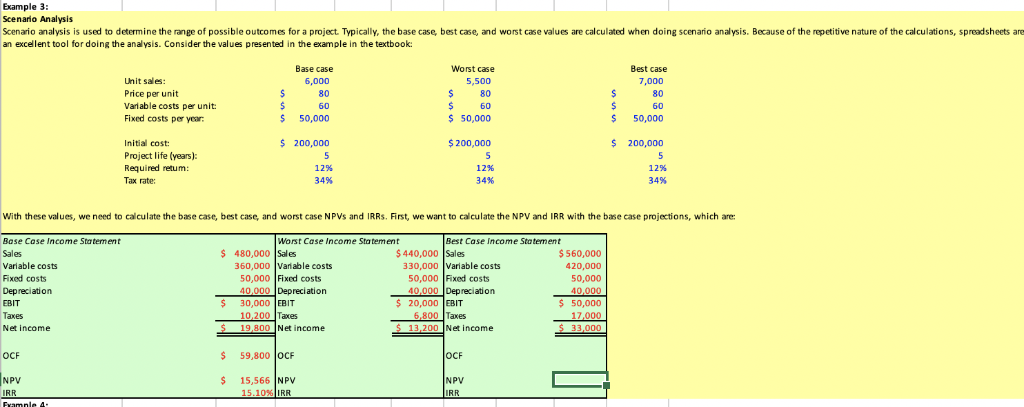
Example 3: Scenario Analysis Scenario analysis is used to determine the range of possible outcomes for a project. Typically, the base case, best case, and worst case values are calculated when doing scenario analysis. Because of the repetitive nature of the calculations, spreadsheets are an excellent tool for doing the analysis. Consider the values presented in the example in the textbook: Base case 6,000 Best case 7.000 80 Worst case 5,500 80 $ $ 50,000 Unit sales: Price per unit Variable costs per unit: Fixed costs per year: 80 60 50,000 50,000 $ 200,000 $ 200,000 $ 200,000 Initial cost: Project life (years): Required retum: Tax rate: 12% 12% 12% 34% 34% With these values, we need to calculate the base case, best case, and worst case NPVs and IRRs. First, we want to calculate the NPV and IRR with the base case projections, which are: $ Base Case Income Statement Sales Variable costs Fixed costs Depreciation EBIT Taxes Net Income Worst Case Income Statement Best Case Income Statement 480,000 Sales $ 440,000 Sales $ 560,000 360,000 Variable costs 330,000 Variable costs 420,000 50,000 Fixed costs 50,000 Fixed costs 50,000 40,000 Depreciation 40,000 Depreciation 40.000 30,000 EBIT $ 20,000 EBIT $ 50,000 10,200 Taxes 6,800 Taxes 17,000 19,800 Net income $ 13,200 Net income $ 33,000 $ OCF $ 59,800 JOCF OCF NPV IRR $ NPV 15,566 NPV 15.10%IRR
Step by Step Solution
There are 3 Steps involved in it

Get step-by-step solutions from verified subject matter experts