

Question: Example # 4 : Table 1 shows a list of the densities at 2 8 days from the results of 4 0 concrete cube test
Example # :
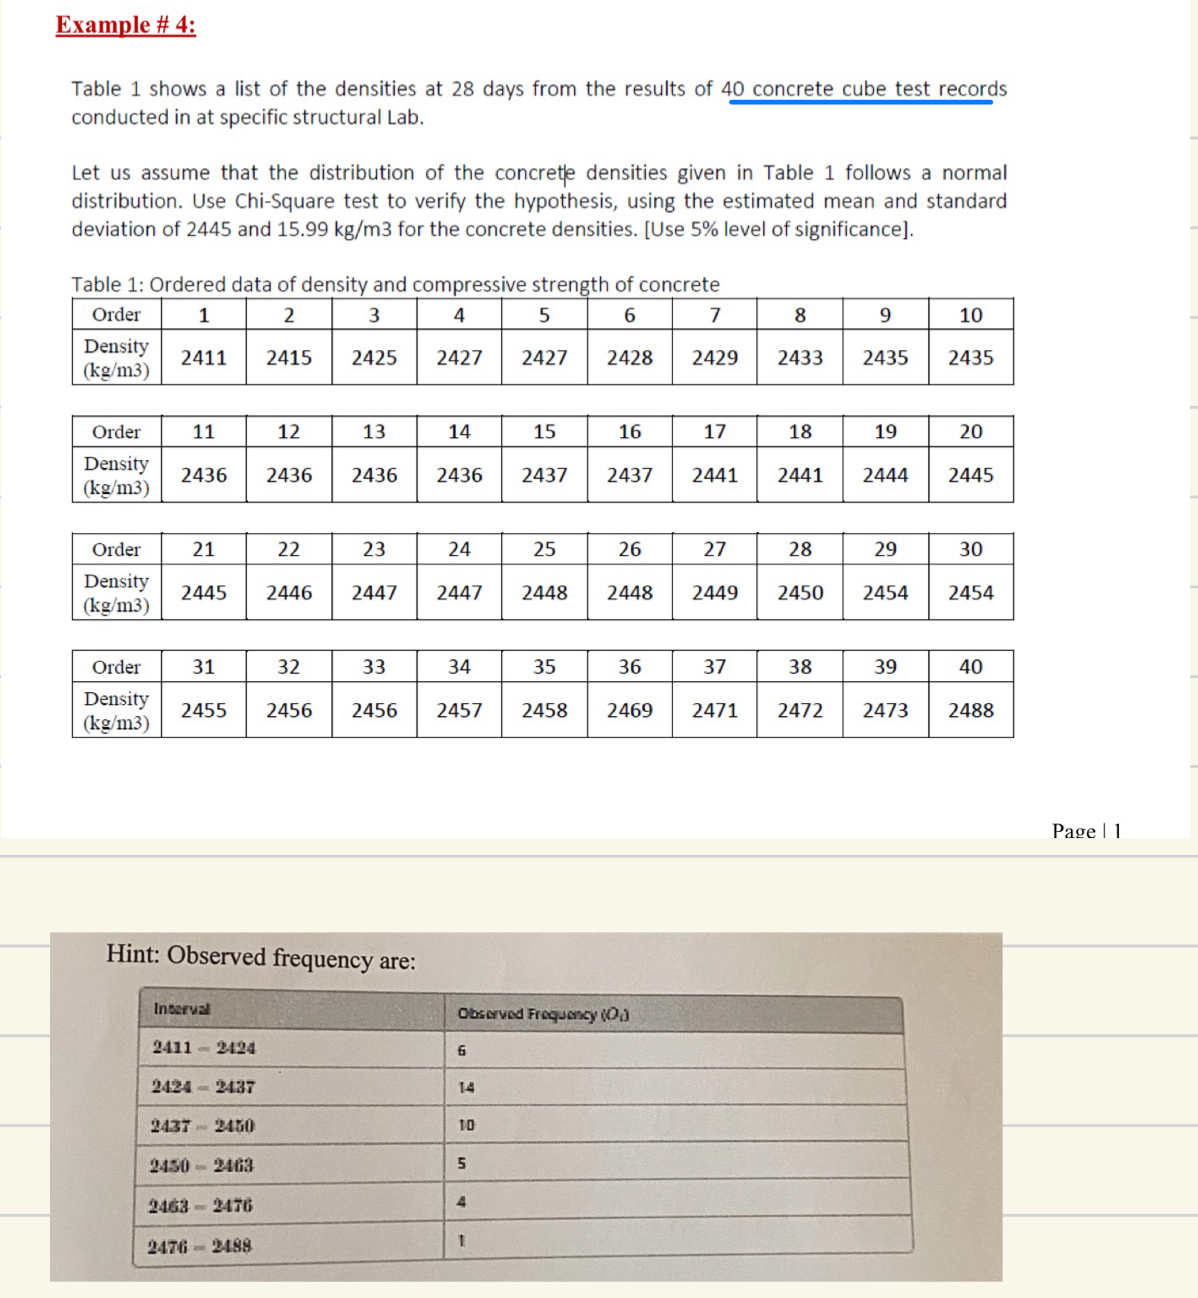
Table shows a list of the densities at days from the results of concrete cube test records conducted in at specific structural Lab.
Let us assume that the distribution of the concrete densities given in Table follows a normal distribution. Use ChiSquare test to verify the hypothesis, using the estimated mean and standard deviation of and for the concrete densities. Use level of significance
Table : Ordered data of density and compressive strength of concrete
tableOrdertableDensity
Step by Step Solution
There are 3 Steps involved in it
1 Expert Approved Answer
Step: 1 Unlock

Question Has Been Solved by an Expert!
Get step-by-step solutions from verified subject matter experts
Step: 2 Unlock
Step: 3 Unlock