

Question: EXAMPLE 7 The graph of a function g is shown in the figure. Use it to state the values ( if they exist ) of
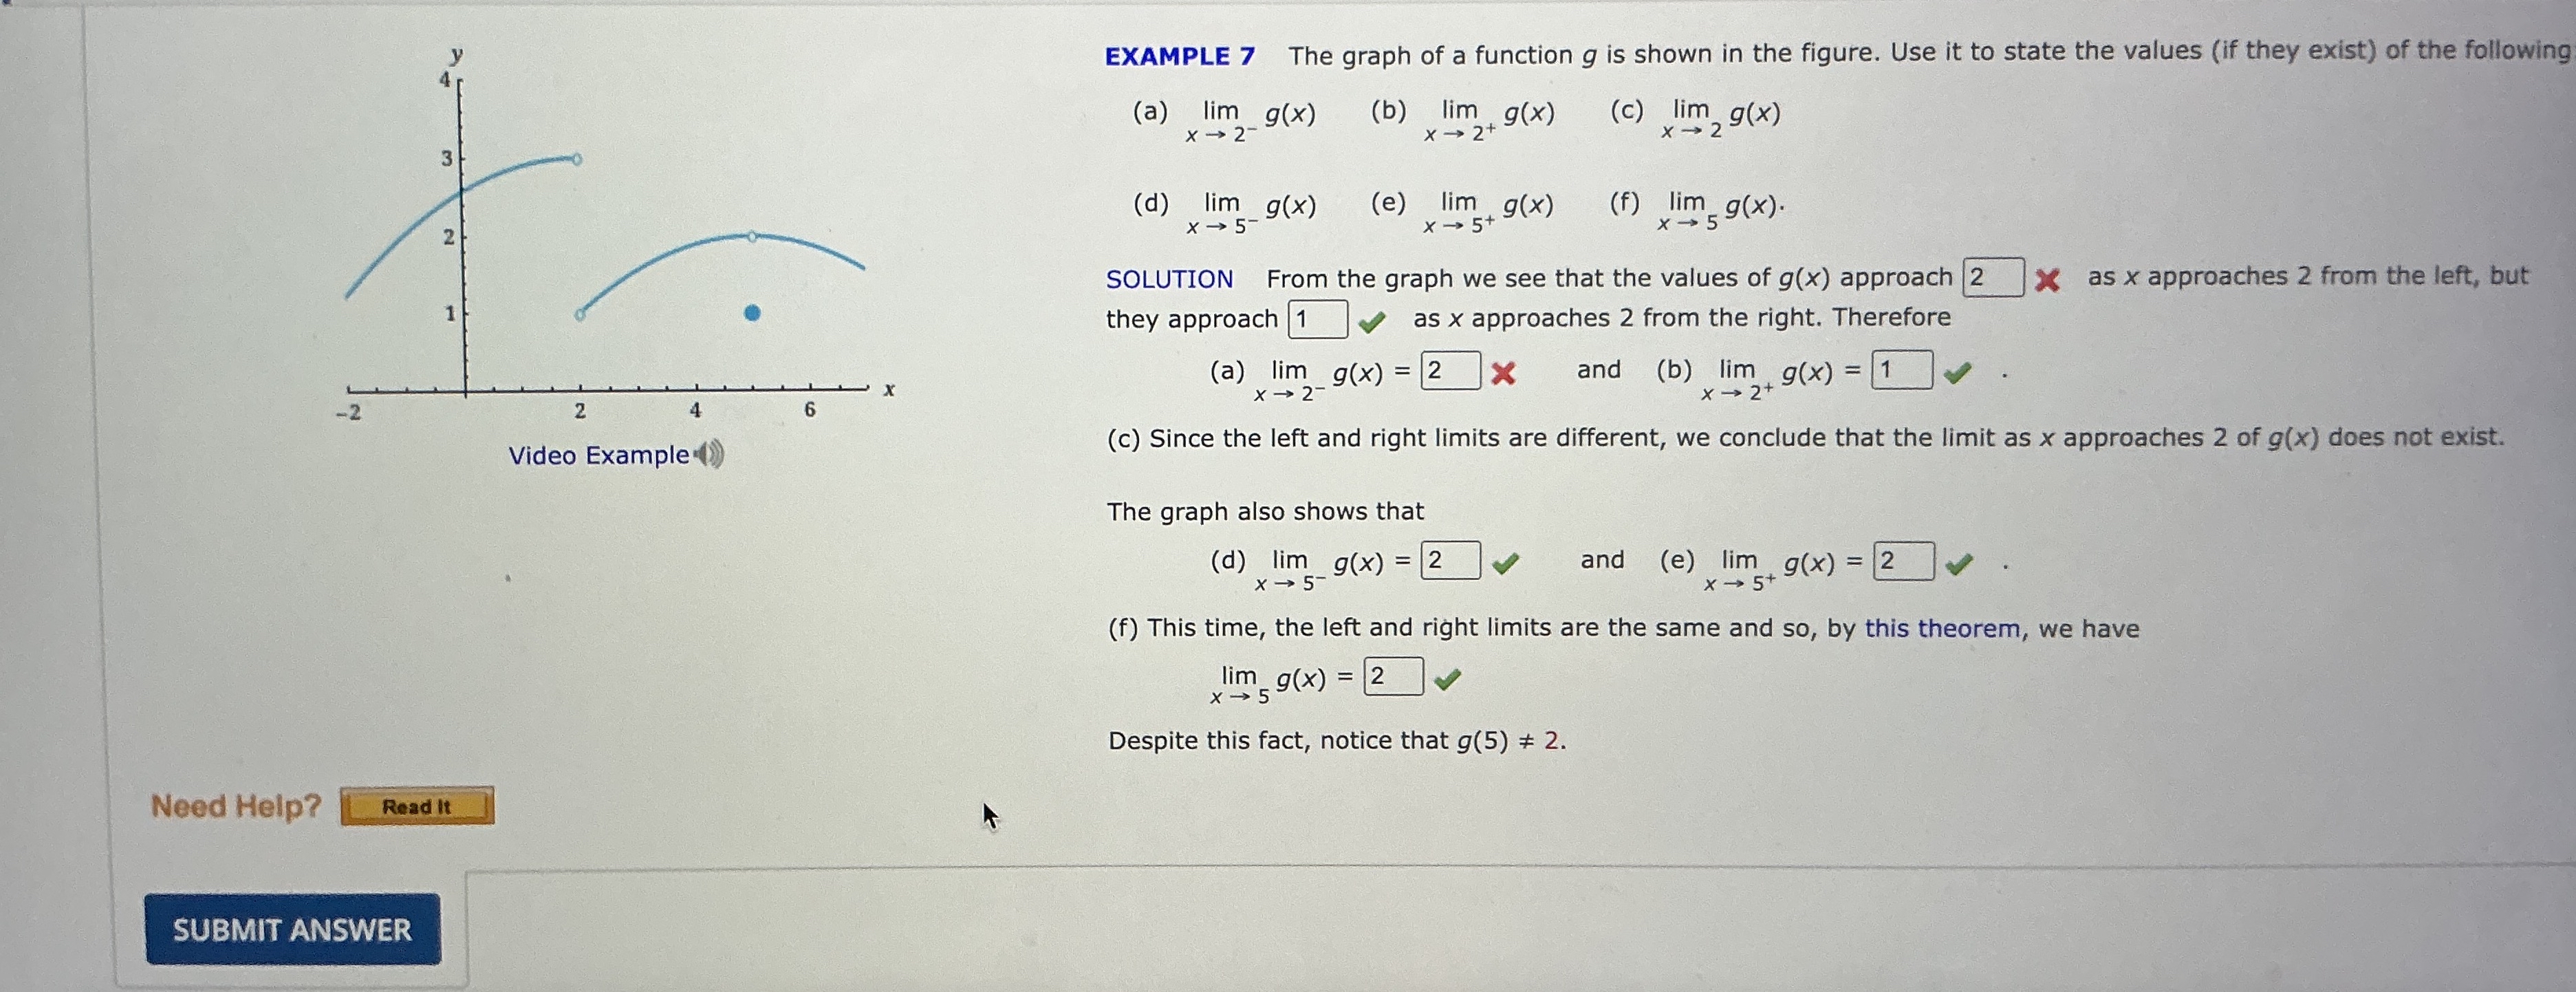
EXAMPLE The graph of a function is shown in the figure. Use it to state the values if they exist of the following
a
b
c
d
e
f
SOLUTION From the graph we see that the values of approach as approaches from the left, but they approach v as approaches from the right. Therefore
a and
b
c Since the left and right limits are different, we conclude that the limit as approaches of does not exist.
The graph also shows that
d and
e
f This time, the left and right limits are the same and so by this theorem, we have
Despite this fact, notice that
Step by Step Solution
There are 3 Steps involved in it
1 Expert Approved Answer
Step: 1 Unlock

Question Has Been Solved by an Expert!
Get step-by-step solutions from verified subject matter experts
Step: 2 Unlock
Step: 3 Unlock