

Question: EXAMPLE 7 The graph of a function g is shown in the figure. Use it to state the values (if they exist) of the following:

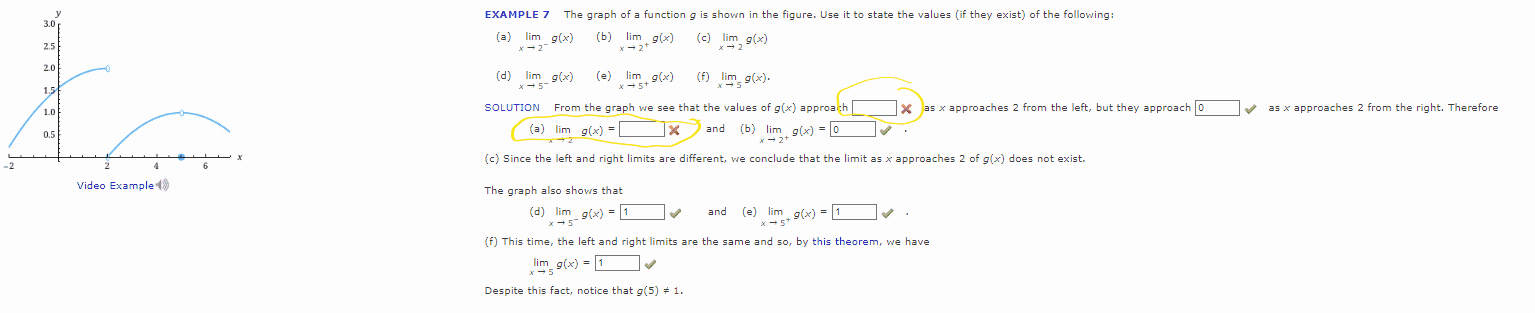
EXAMPLE 7 The graph of a function g is shown in the figure. Use it to state the values (if they exist) of the following: 3.0 2.5 (a) lim g(x) (b) lim g(x) (c) lim, s(x) 2.0 (d) lim g(x) (e) lim g(x) (f) lim, g(x). 15 1.0 SOLUTION From the graph we see that the values of g(x) approach 1X as x approaches 2 from the left, but they approach |0 as x approaches 2 from the right. Therefore 05 (a) lim g(x) = 1x ) and (b) lim g(x) = 0 -2 (c) Since the left and right limits are different, we conclude that the limit as x approaches 2 of g(x) does not exist. Video Example The graph also shows that (d) lim_g(x) = 1 and (e) lim g(x) = 1 (f) This time, the left and right limits are the same and so, by this theorem, we have lim g(x) = 1 Despite this fact, notice that g(5) # 1
Step by Step Solution
There are 3 Steps involved in it

Get step-by-step solutions from verified subject matter experts