

Question: Example: In a 0 system, the demand rate for strawberty ice cream is normally distributed, with an average of 295 pints per week. The lead
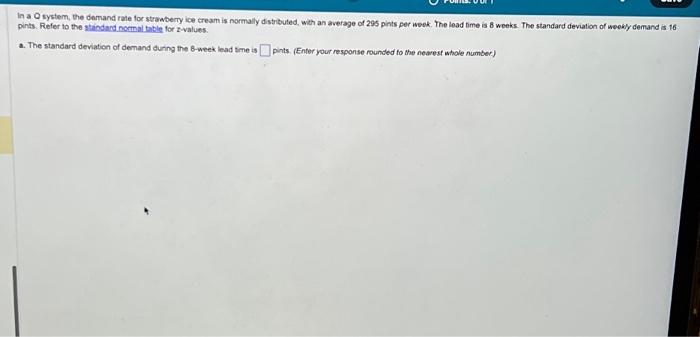
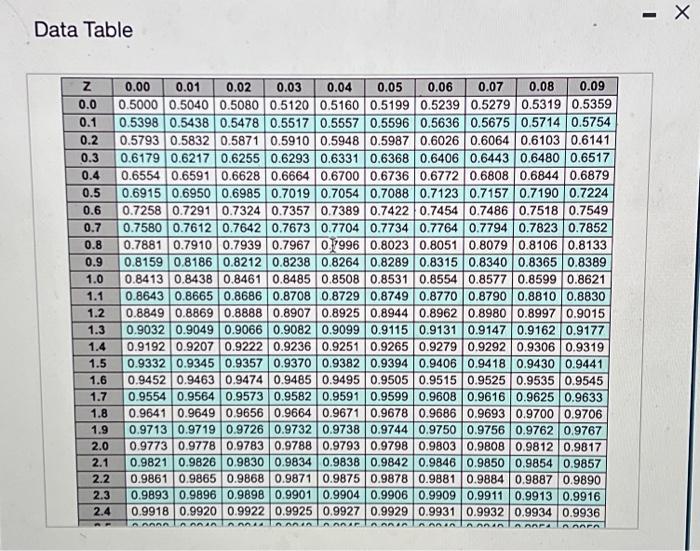
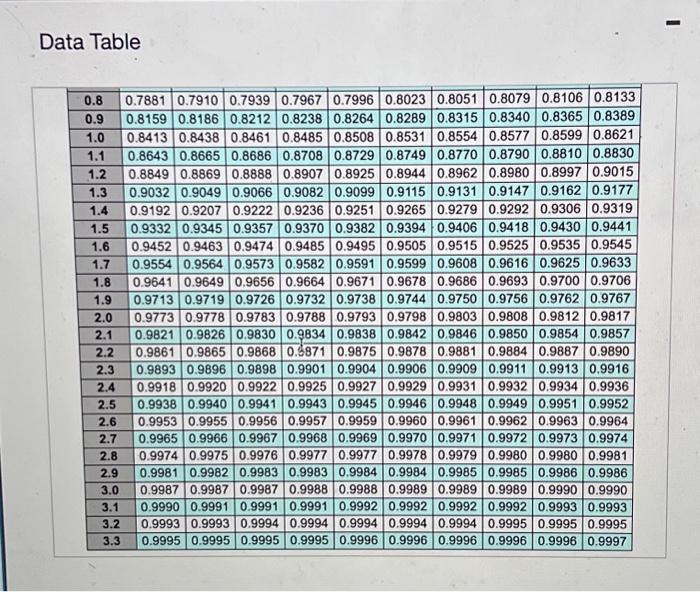
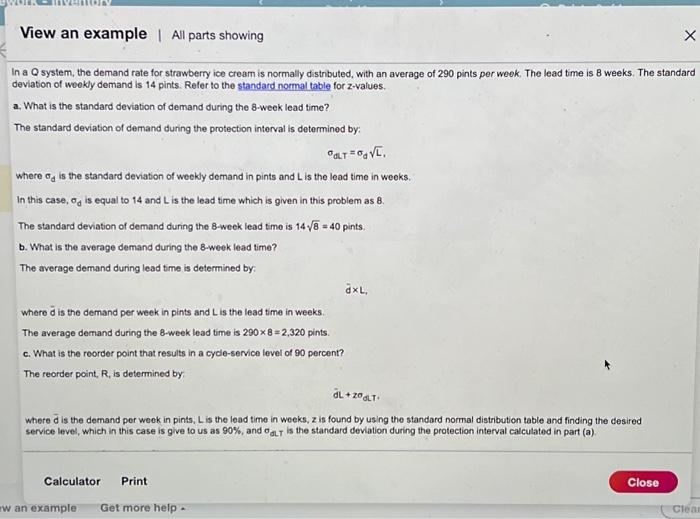
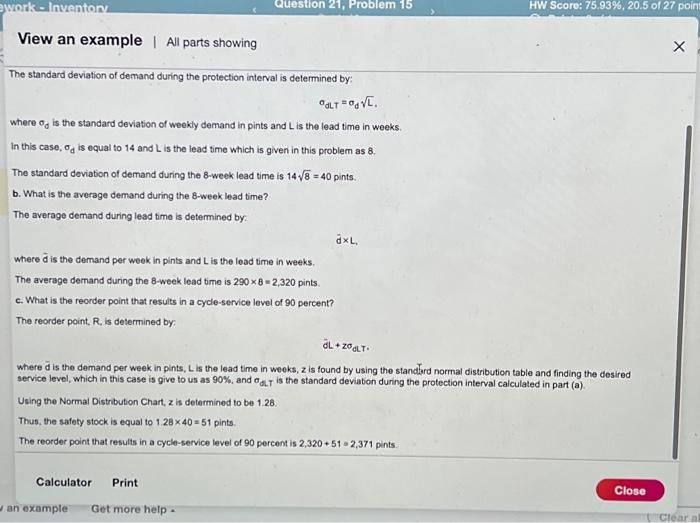
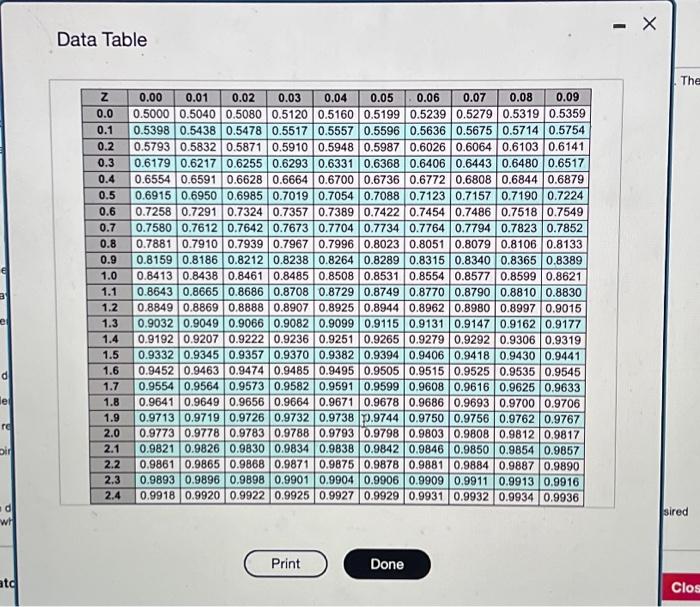
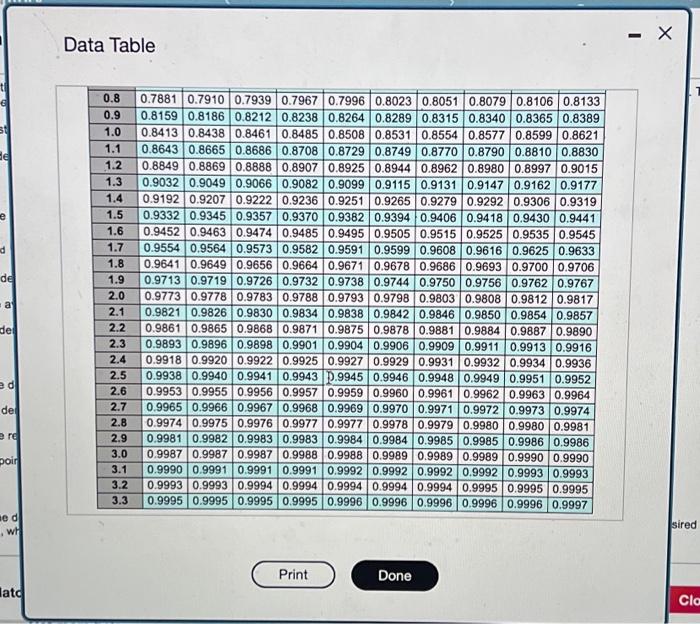
In a 0 system, the demand rate for strawberty ice cream is normally distributed, with an average of 295 pints per week. The lead time is 8 weeks. The standard deviation of weekly demand is 16 pints. Refer to the staindard, nomal boble for z-values. a. The standard deviation of demand during the 8-week lead tme is pints. (Enter your response rounded fo the neavest whole number) Data Table Data Table The standard deviation of demand during the protection interval is determined by: dLT=dL. where d is the standard deviation of weekly demand in pints and L is the lead time in weeks. In this case, d is equal to 14 and L is the lead time which is given in this problem as 8 . The standard doviabion of demand during the 8 -week lead time is 148=40 pints. b. What is the average demand during the 8-week lead time? The average demand during lead time is determined by: dL where d is the demand per week in pints and L is the lead time in weeks. The average dernand during the 8 -week lead time is 2908=2,320 pints. c. What is the reorder point that results in a cycle-service level of 90 percent? The reorder point, R, is determined by: dL+zeLT. Where d is the demand per week in pints, L is the lead time in weeks, z is found by using the standlard normal distribution table and finding the desired service level, which in this case is give to us as 90%, and .T is the standard deviation during the protection interval calculated in part (a). Using the Normal Distribution Chart, z is determined to be 1.28 . Thus, the safety stock is equal to 1.2840=51 pints. The reorder point that results in a cycle-service level of 90 percent is 2,320+51=2,371 pints. In a Q system, the demand rate for strawberry ice cream is normally distributed, with an average of 290 pints per week. The lead time is 8 weeks. The standard deviation of weekly demand is 14 pints. Refer to the standard normal table for z-values. a. What is the standard deviation of demand during the 8-week lead time? The standard deviation of demand during the protection interval is determined by: dLT=dL. Where d is the standard deviation of weekly demand in pints and L is the lead time in weeks. In this case, d is equal to 14 and L is the lead time which is given in this problem as 8 . The standard deviation of demand during the 8 -week lead time is 148=40 pints. b. What is the average demand during the 8-week lead time? The average demand during lead time is determined by: d~L, where d is the demand per week in pints and L is the lead time in weeks. The average demand during the 8 -week lead time is 2908=2,320 pints. c. What is the roorder point that results in a cycle-service level of 90 percent? The reorder point, R, is determined by: dL+2dLT+ Where d is the demand per week in pints, L is the lead time in weeks, z is found by using the standard normal distribution table and finding the desired service level, which in this case is give to us as 90%, and dLt is the standard deviation during the protection interval calculated in part (a). Data Table Data Table In a 0 system, the demand rate for strawberty ice cream is normally distributed, with an average of 295 pints per week. The lead time is 8 weeks. The standard deviation of weekly demand is 16 pints. Refer to the staindard, nomal boble for z-values. a. The standard deviation of demand during the 8-week lead tme is pints. (Enter your response rounded fo the neavest whole number) Data Table Data Table The standard deviation of demand during the protection interval is determined by: dLT=dL. where d is the standard deviation of weekly demand in pints and L is the lead time in weeks. In this case, d is equal to 14 and L is the lead time which is given in this problem as 8 . The standard doviabion of demand during the 8 -week lead time is 148=40 pints. b. What is the average demand during the 8-week lead time? The average demand during lead time is determined by: dL where d is the demand per week in pints and L is the lead time in weeks. The average dernand during the 8 -week lead time is 2908=2,320 pints. c. What is the reorder point that results in a cycle-service level of 90 percent? The reorder point, R, is determined by: dL+zeLT. Where d is the demand per week in pints, L is the lead time in weeks, z is found by using the standlard normal distribution table and finding the desired service level, which in this case is give to us as 90%, and .T is the standard deviation during the protection interval calculated in part (a). Using the Normal Distribution Chart, z is determined to be 1.28 . Thus, the safety stock is equal to 1.2840=51 pints. The reorder point that results in a cycle-service level of 90 percent is 2,320+51=2,371 pints. In a Q system, the demand rate for strawberry ice cream is normally distributed, with an average of 290 pints per week. The lead time is 8 weeks. The standard deviation of weekly demand is 14 pints. Refer to the standard normal table for z-values. a. What is the standard deviation of demand during the 8-week lead time? The standard deviation of demand during the protection interval is determined by: dLT=dL. Where d is the standard deviation of weekly demand in pints and L is the lead time in weeks. In this case, d is equal to 14 and L is the lead time which is given in this problem as 8 . The standard deviation of demand during the 8 -week lead time is 148=40 pints. b. What is the average demand during the 8-week lead time? The average demand during lead time is determined by: d~L, where d is the demand per week in pints and L is the lead time in weeks. The average demand during the 8 -week lead time is 2908=2,320 pints. c. What is the roorder point that results in a cycle-service level of 90 percent? The reorder point, R, is determined by: dL+2dLT+ Where d is the demand per week in pints, L is the lead time in weeks, z is found by using the standard normal distribution table and finding the desired service level, which in this case is give to us as 90%, and dLt is the standard deviation during the protection interval calculated in part (a). Data Table Data Table
Step by Step Solution
There are 3 Steps involved in it

Get step-by-step solutions from verified subject matter experts