

Question: EXAMPLE - MAD WITH HISTORICAL DATA The table below provides actual sales for years 1 through 7 . The firm uses a three - year
EXAMPLEMAD WITH HISTORICAL DATA
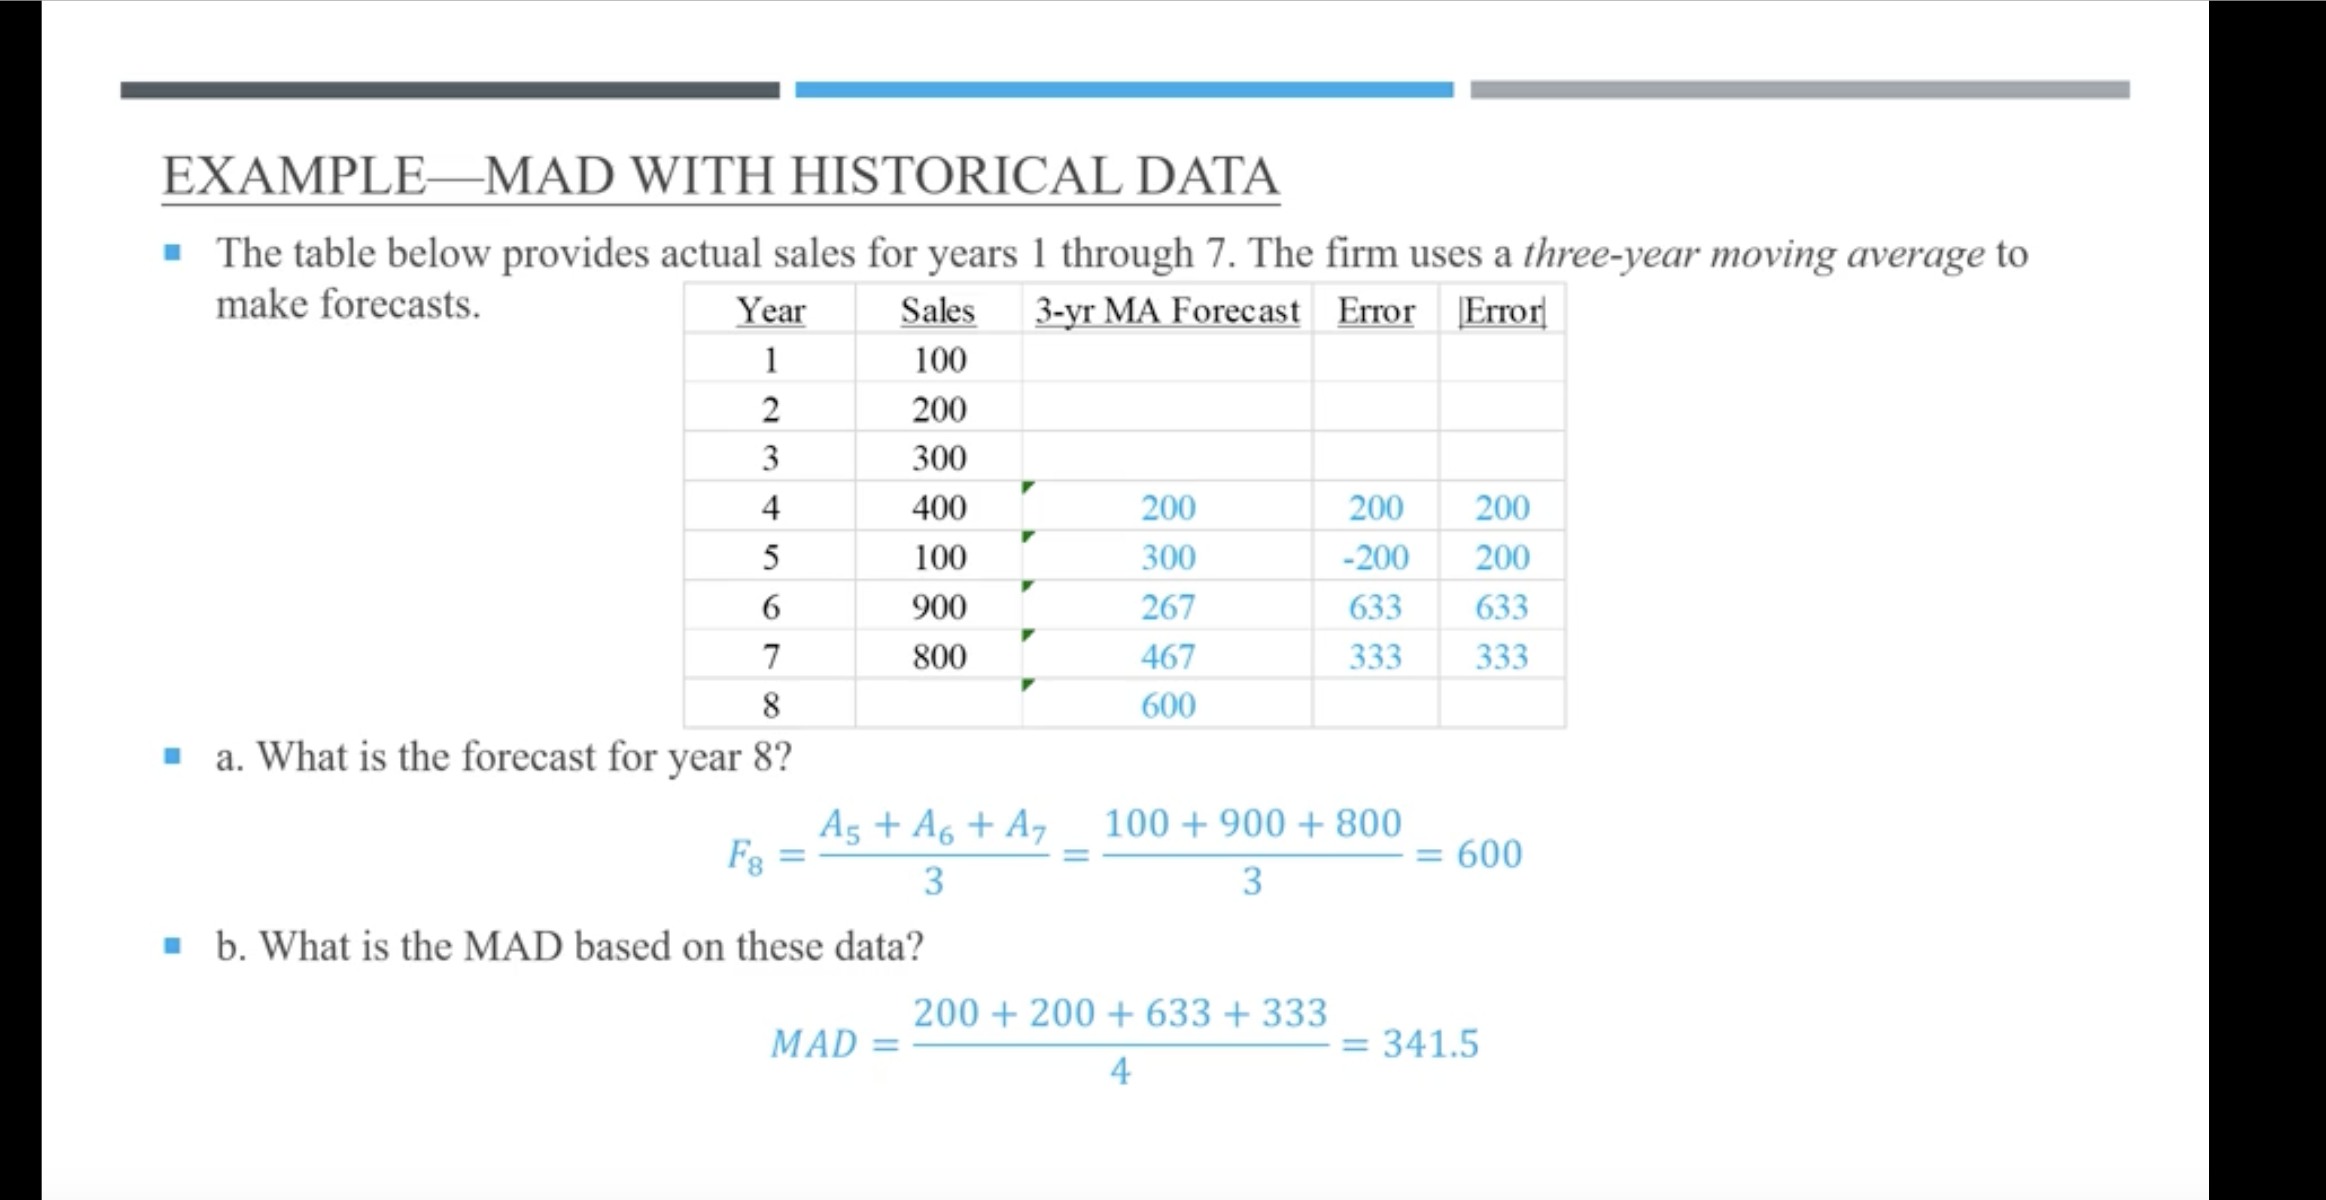
The table below provides actual sales for years through The firm uses a threeyear moving average to
make forecasts.
a What is the forecast for year
b What is the MAD based on these data?
MAD
c Suppose the company uses a year MA instead of a year MA for forecasting, what is the new MAD?
Step by Step Solution
There are 3 Steps involved in it
1 Expert Approved Answer
Step: 1 Unlock

Question Has Been Solved by an Expert!
Get step-by-step solutions from verified subject matter experts
Step: 2 Unlock
Step: 3 Unlock