

Question: example of the wind stat data formated in year, month, day with the 12 locations wind speed following part a) part b) For wind_stat data,
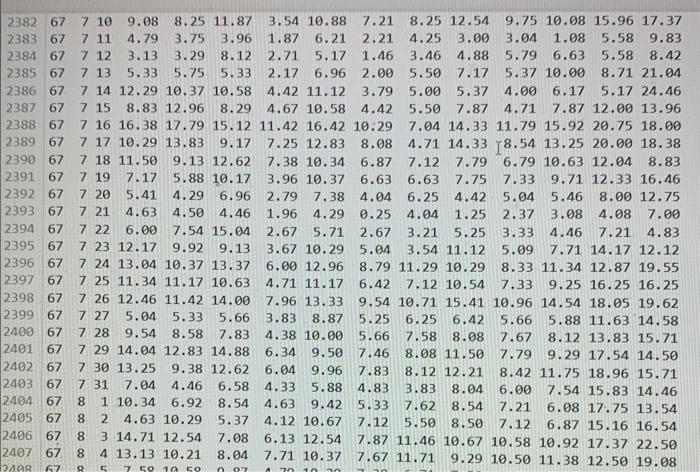
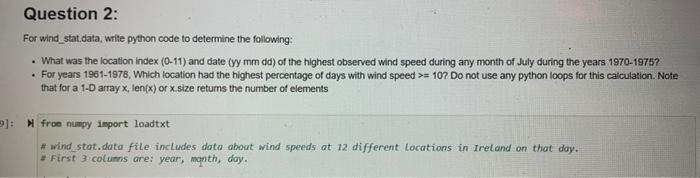

For wind_stat data, write python code to determine the following: - What was the location index (0-11) and date (yy mm dd) of the highest observed wind speed during any month of July during the years 1970 -1975? - For years 1961-1978, Which location had the highest percentage of days with wind speed >=10 ? Do not use any python loops for this calculation. Note that for a 1-D array x, len (x) or x size retums the number of elements H froe numpy inport loadt xt. * aind stat.data file includes data about wind speeds at 12 different Locations in Iretand on that day. * First 3 colums are: year, manth, day. For Wind stat data, Write python code to deiver the following - As a measure of potential for wind energy, compute the assessment value A=(mean wind speed) /( std. dev. of wind speed) for each location during the period 19611978. - For the location with the highest assessment value, A, plot a histogram of wind speed using a simpie bar chart with
Step by Step Solution
There are 3 Steps involved in it

Get step-by-step solutions from verified subject matter experts