

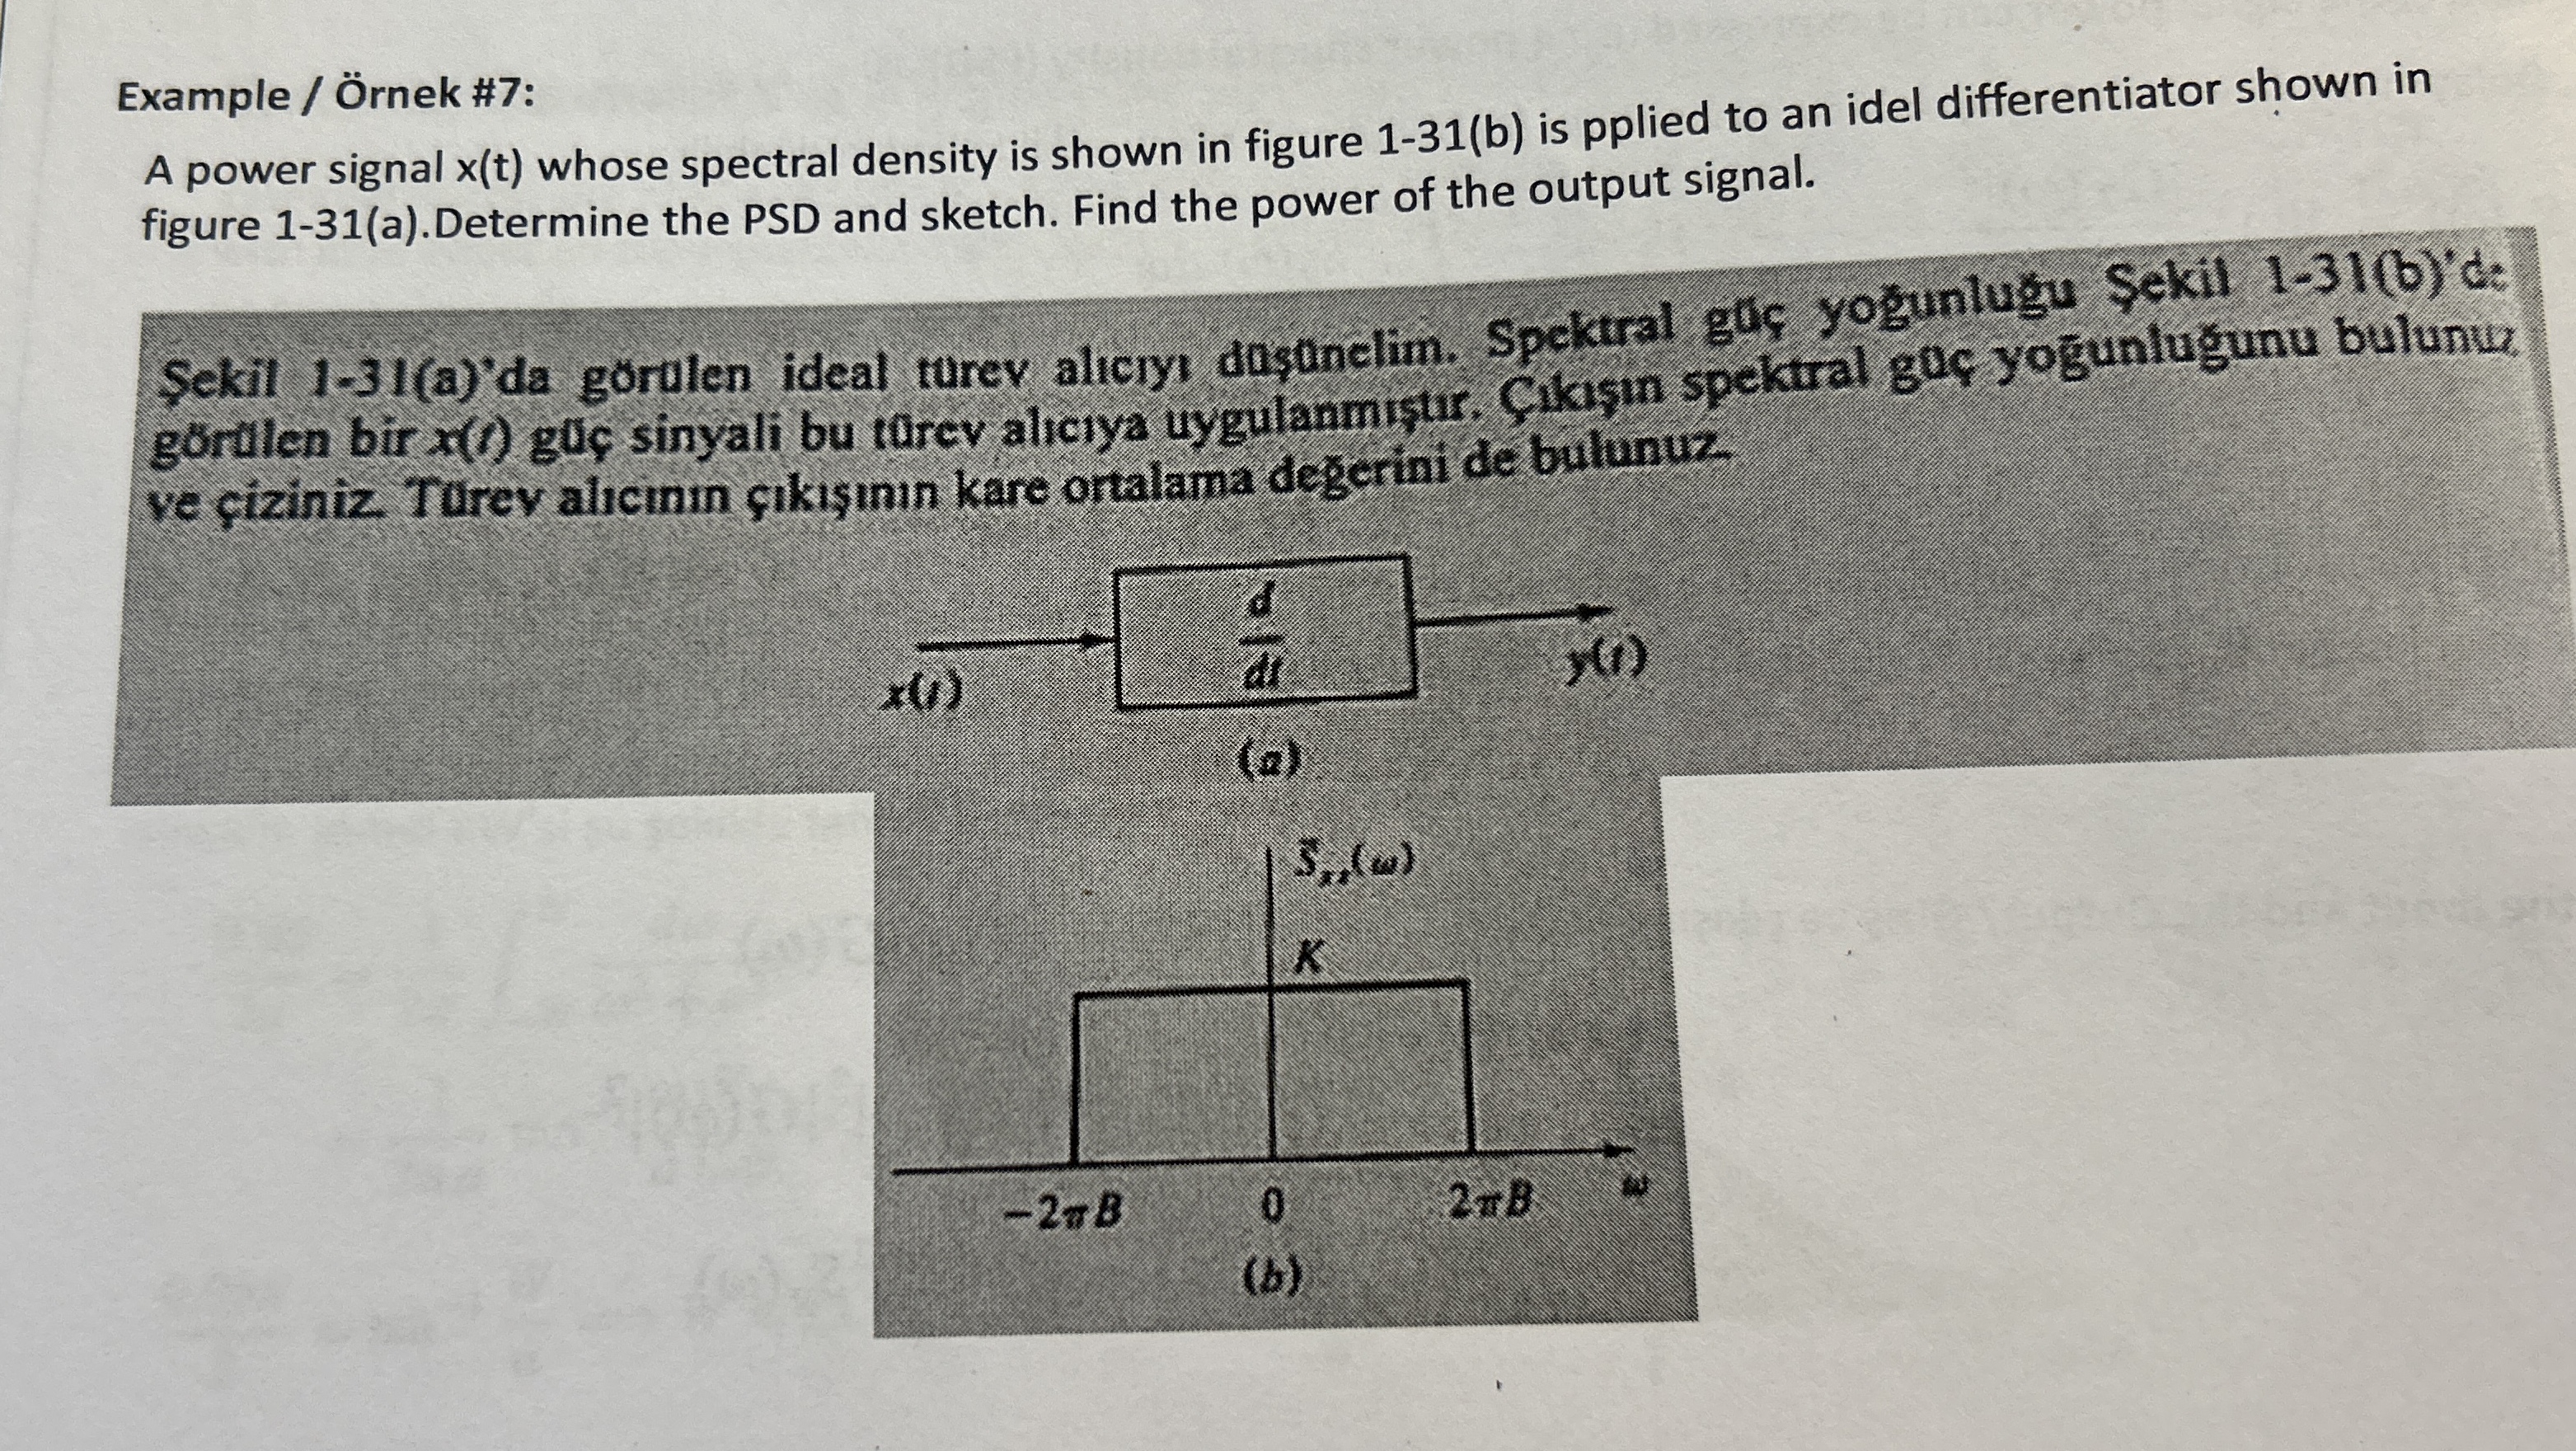
Question: Example / rnek # 7 : A power signal x ( t ) whose spectral density is shown in figure 1 - 3 1 (
Example rnek #:
A power signal whose spectral density is shown in figure b is pplied to an idel differentiator shown in figure aDetermine the PSD and sketch. Find the power of the output signal.
Sekil ada gorulen ideal turev alcicy dasanelim. Spekrral gc yogunlugu Sekil bde gordlen bir gl sinyali bu turev alicya uygulanmisur. Cikisin spektral gac yogunlugunu bulunue ve iziniz Trev alcmm ikn kare ortalama degerini de bulunuz.
Step by Step Solution
There are 3 Steps involved in it
1 Expert Approved Answer
Step: 1 Unlock

Question Has Been Solved by an Expert!
Get step-by-step solutions from verified subject matter experts
Step: 2 Unlock
Step: 3 Unlock