

Question: example script: % data points x = [10 20 30 40 50 60 70 80]; y = [25 70 380 550 610 1220 830 1450];
example script:
% data points x = [10 20 30 40 50 60 70 80]; y = [25 70 380 550 610 1220 830 1450];
% a = fminsearch(@fSSR, [1, 1], [], x, y);
% define anonymous function for the sum of the squares of the residuals for % the nonlinear power law fit with a(1) and a(2) as the unknown % coefficients fSSR = @(a,xm,ym) sum((ym-(a(1)*xm.^a(2))).^2);
% initial guess for the coefficients guess_a = [1,1];
% apply MATLAB's search method to minimize 'fSSR' function a = fminsearch(fSSR, guess_a, [], x, y)
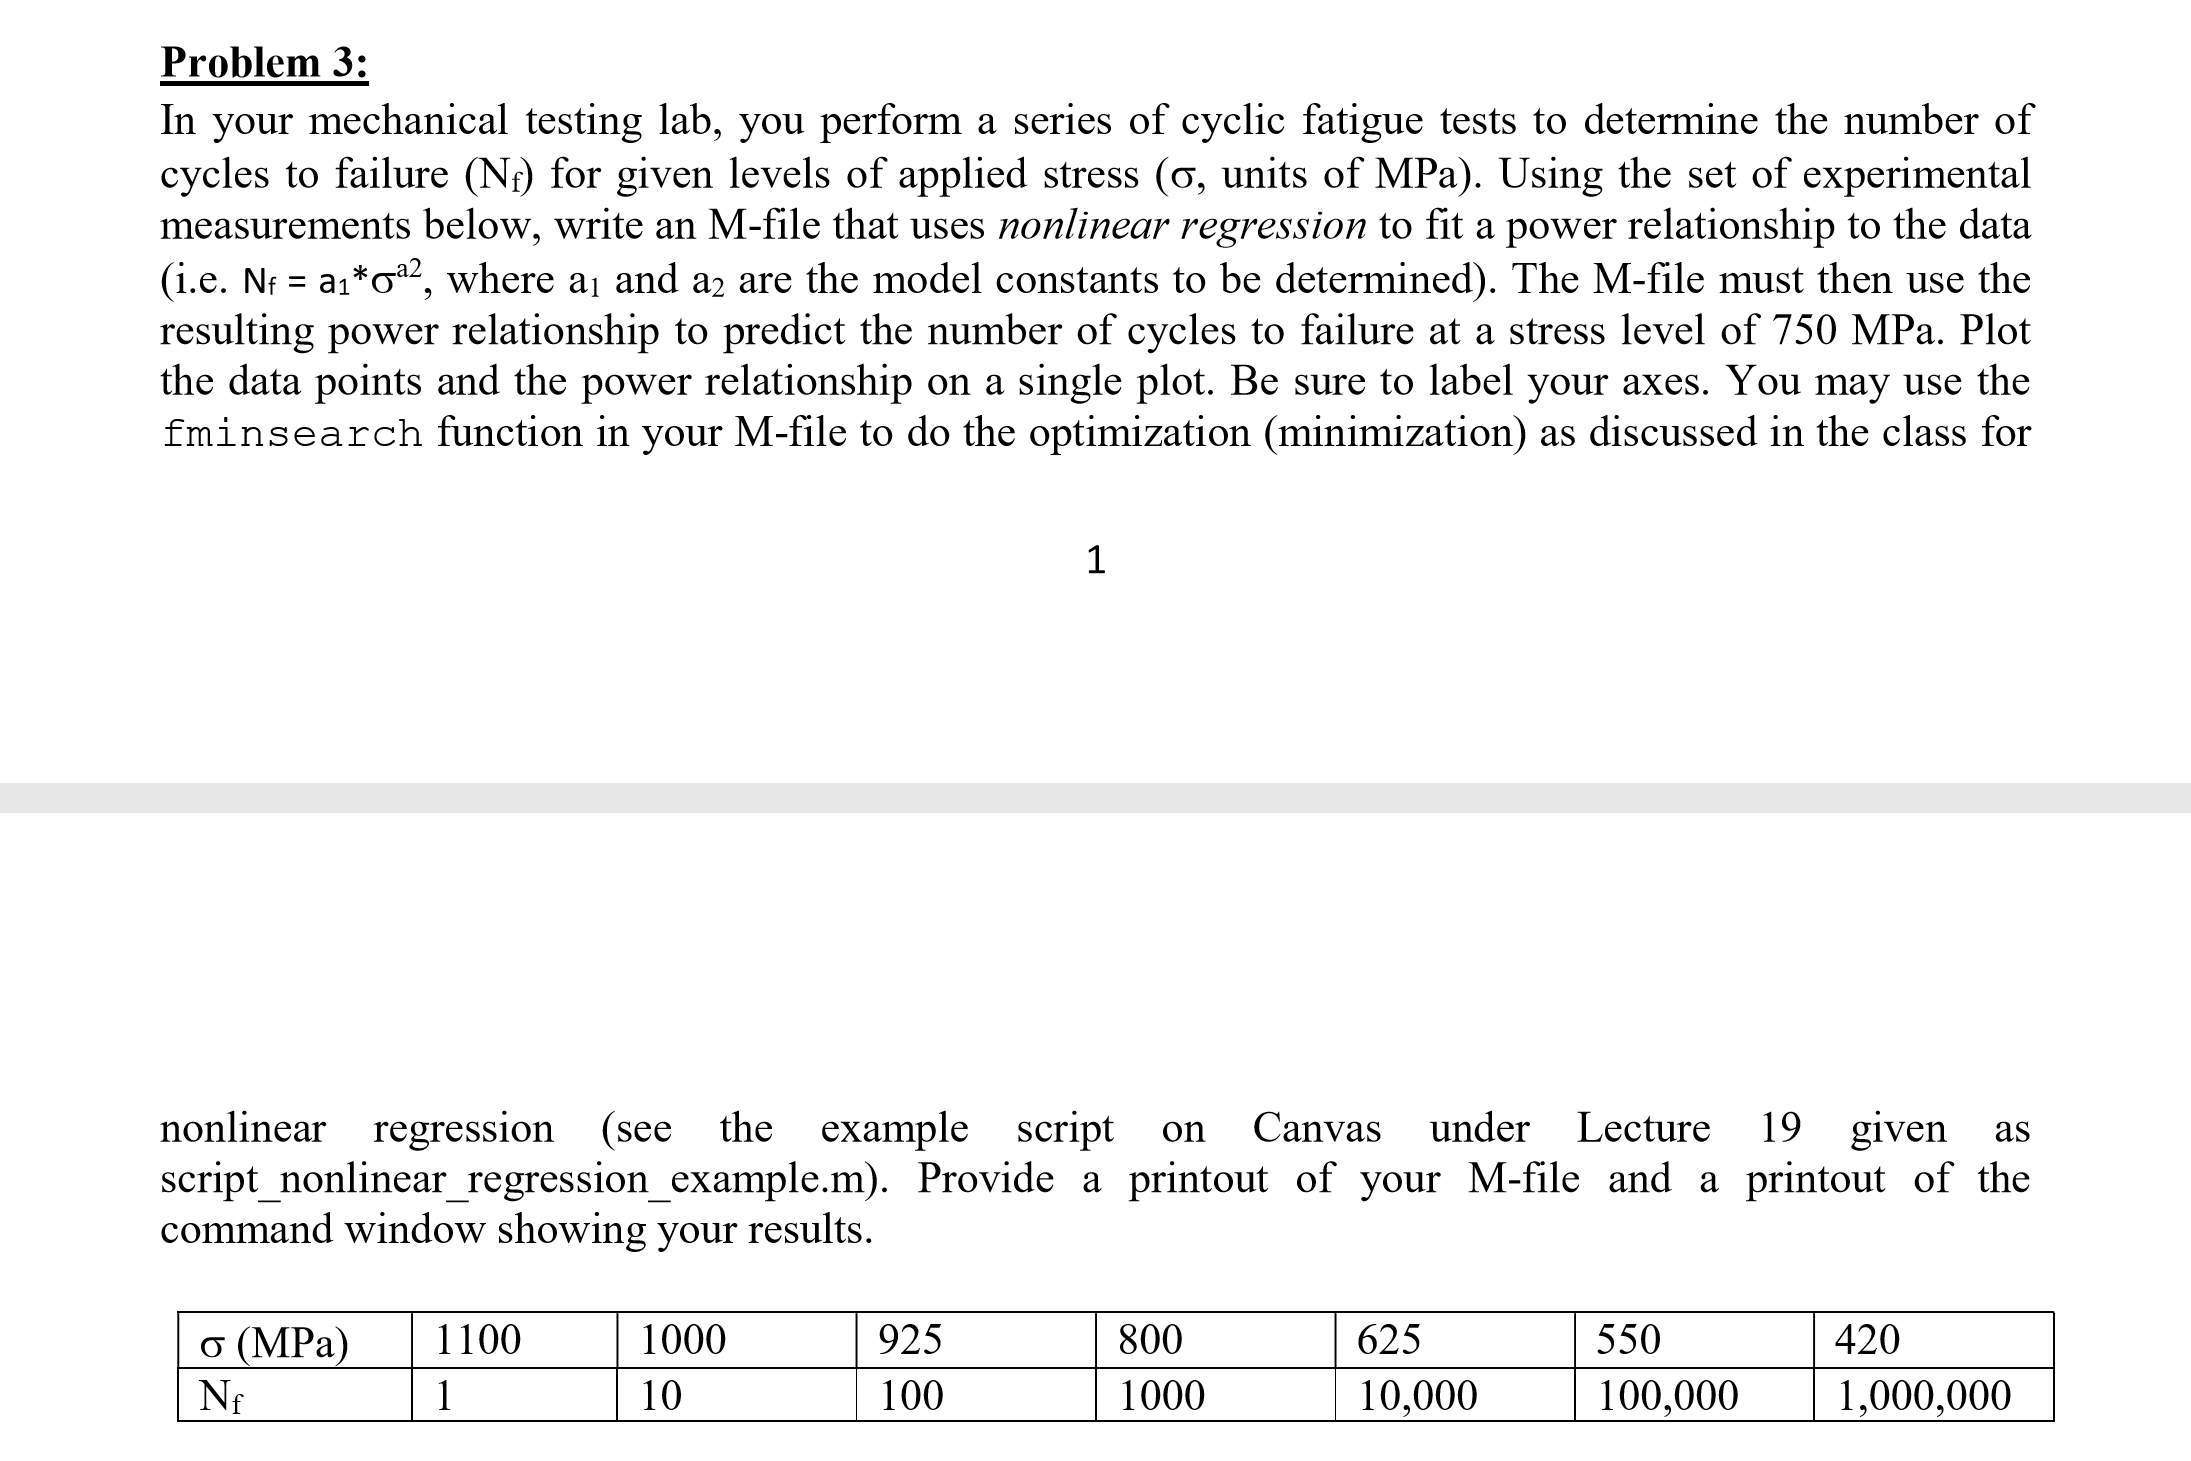
Problem 3: In your mechanical testing lab, you perform a series of cyclic fatigue tests to determine the number of cycles to failure(N) for given levels of applied stress (' units of MPa). Using the set of experimental measurements below, write an M-file that uses nonlinear regression to fit a power relationship to the data (i.e. N: a1*a2, where al and a2 are the model constants to be determined). The M-file must then use the resulting power relationship to predict the number of cycles to failure at a stress level of 750 MPa. Plot the data points and the power relationship on a single plot. Be sure to label your axes. You may use the fminsearch function in your M-file to do the optimization (minimization) as discussed in the class for 1 nonlinear regression (see the example script on Canvas under Lecture 19 given as script nonlinear regression example.m). Provide a printout of yourM-file and a printout of the command window showing your results, 925 100 800 1000 625 10,000 550 100,000 420 1,000,000 o (MPa) 1100 1000 Problem 3: In your mechanical testing lab, you perform a series of cyclic fatigue tests to determine the number of cycles to failure(N) for given levels of applied stress (' units of MPa). Using the set of experimental measurements below, write an M-file that uses nonlinear regression to fit a power relationship to the data (i.e. N: a1*a2, where al and a2 are the model constants to be determined). The M-file must then use the resulting power relationship to predict the number of cycles to failure at a stress level of 750 MPa. Plot the data points and the power relationship on a single plot. Be sure to label your axes. You may use the fminsearch function in your M-file to do the optimization (minimization) as discussed in the class for 1 nonlinear regression (see the example script on Canvas under Lecture 19 given as script nonlinear regression example.m). Provide a printout of yourM-file and a printout of the command window showing your results, 925 100 800 1000 625 10,000 550 100,000 420 1,000,000 o (MPa) 1100 1000
Step by Step Solution
There are 3 Steps involved in it

Get step-by-step solutions from verified subject matter experts