

Question: . EXAMPLE The following table gives data on normal time and cost and crash time and cost for a project (a) Draw the network and
.
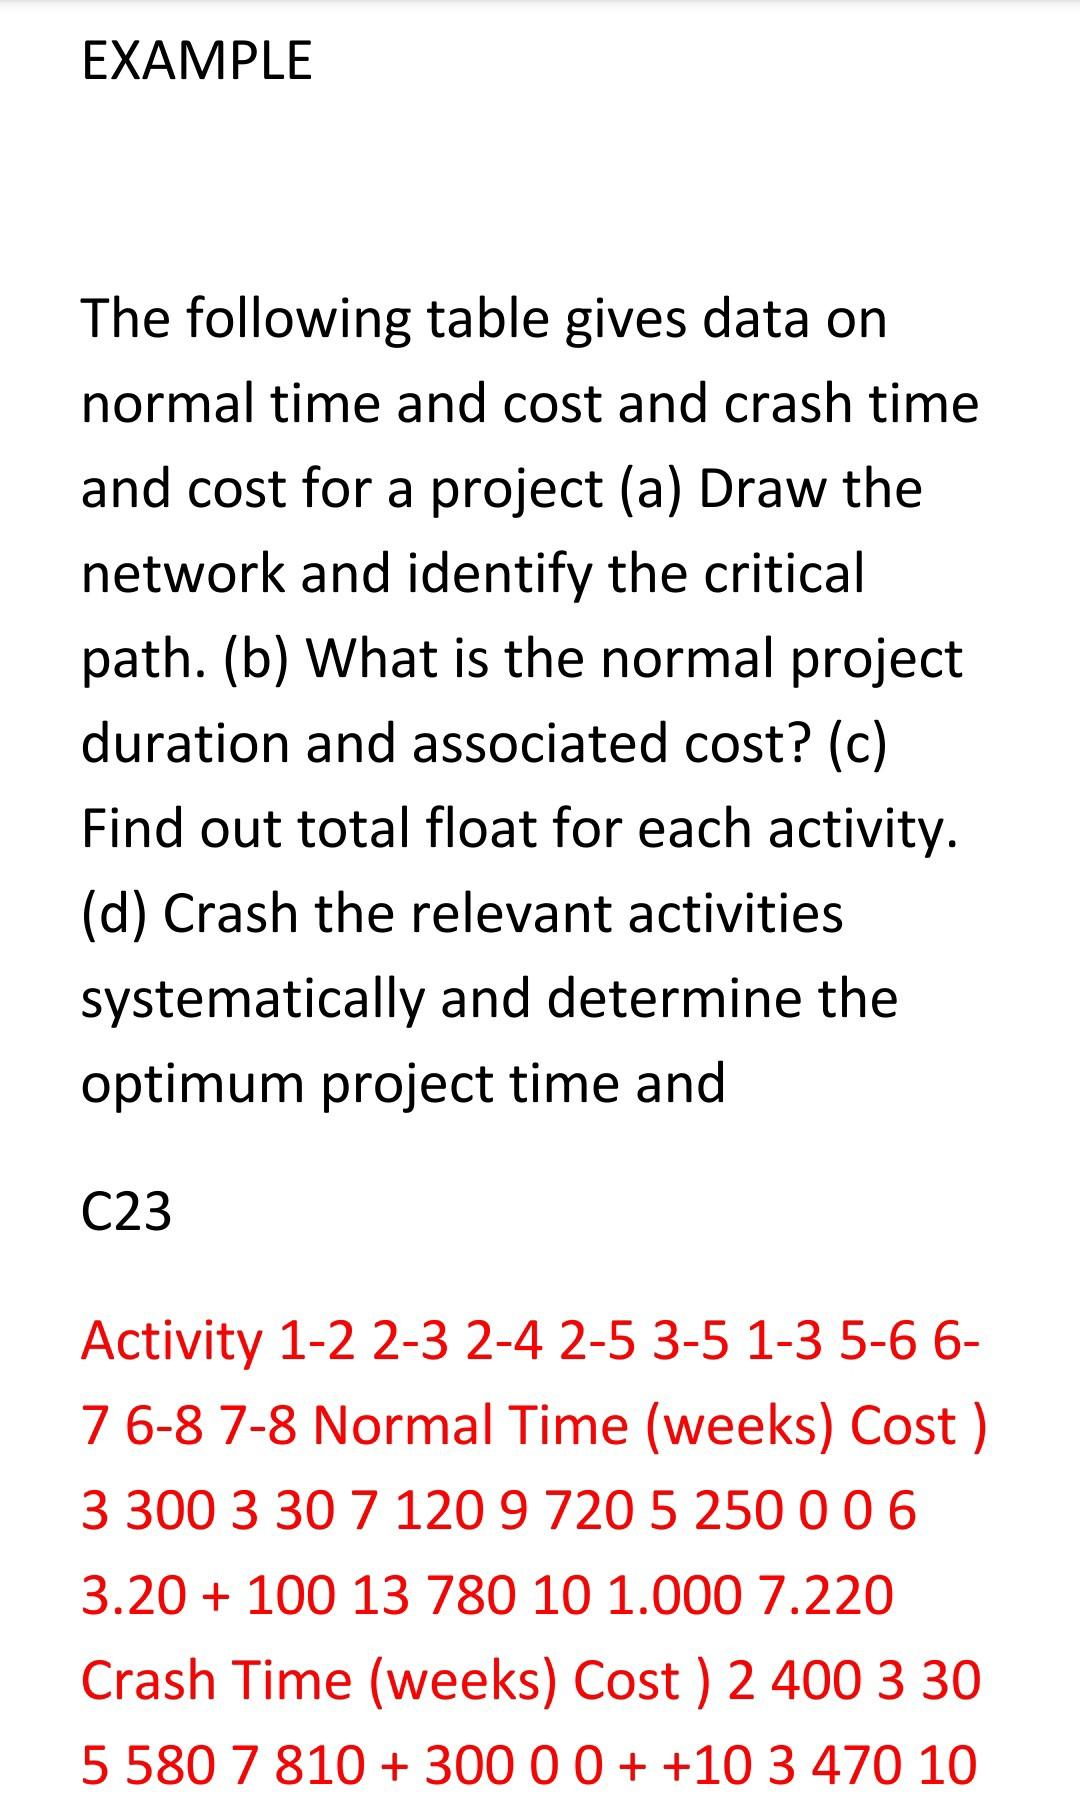
EXAMPLE The following table gives data on normal time and cost and crash time and cost for a project (a) Draw the network and identify the critical path. (b) What is the normal project duration and associated cost? (c) Find out total float for each activity. (d) Crash the relevant activities systematically and determine the optimum project time and C23 Activity 1-2 2-3 2-4 2-5 3-5 1-3 5-6 6- 7 6-8 7-8 Normal Time (weeks) Cost ) 3 300 3 30 7 120 9 720 5 250 006 3.20 + 100 13 780 10 1.000 7.220 Crash Time (weeks) Cost ) 2 400 3 30 5 580 7 810 + 300 0 0 + +10 3 470 10 EXAMPLE The following table gives data on normal time and cost and crash time and cost for a project (a) Draw the network and identify the critical path. (b) What is the normal project duration and associated cost? (c) Find out total float for each activity. (d) Crash the relevant activities systematically and determine the optimum project time and C23 Activity 1-2 2-3 2-4 2-5 3-5 1-3 5-6 6- 7 6-8 7-8 Normal Time (weeks) Cost ) 3 300 3 30 7 120 9 720 5 250 006 3.20 + 100 13 780 10 1.000 7.220 Crash Time (weeks) Cost ) 2 400 3 30 5 580 7 810 + 300 0 0 + +10 3 470 10Step by Step Solution
There are 3 Steps involved in it
1 Expert Approved Answer
Step: 1 Unlock

Question Has Been Solved by an Expert!
Get step-by-step solutions from verified subject matter experts
Step: 2 Unlock
Step: 3 Unlock