

Question: Example ( Unequal sample sizes ) : A factory manufacturing small bolts. To check the quality of the bolts, the manufacturer selected 1 0 samples
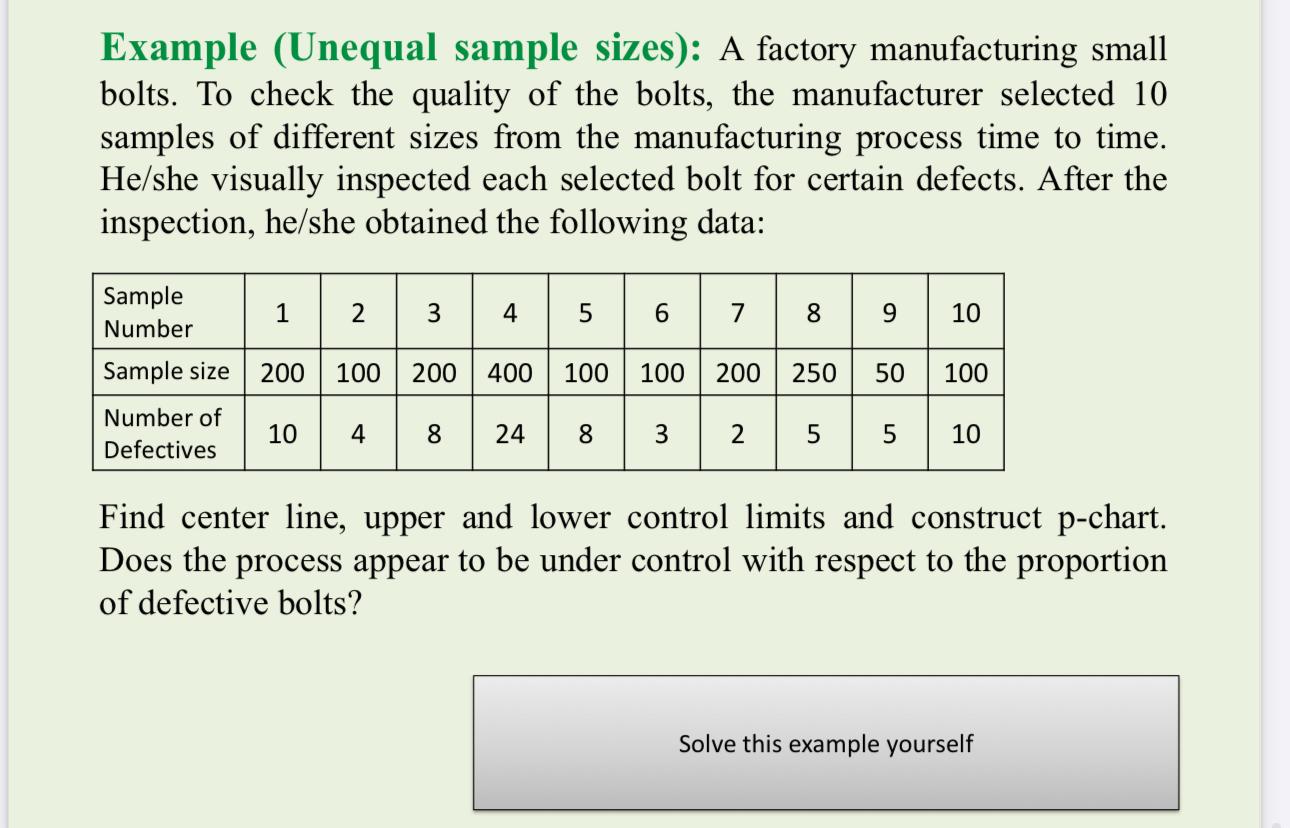
Example Unequal sample sizes: A factory manufacturing small bolts. To check the quality of the bolts, the manufacturer selected samples of different sizes from the manufacturing process time to time. she visually inspected each selected bolt for certain defects. After the inspection, heshe obtained the following data:
tabletableSampleNumberSample size,tableNumber ofDefectives
Find center line, upper and lower control limits and construct pchart. Does the process appear to be under control with respect to the proportion of defective bolts?
Solve this example yourself
Step by Step Solution
There are 3 Steps involved in it
1 Expert Approved Answer
Step: 1 Unlock

Question Has Been Solved by an Expert!
Get step-by-step solutions from verified subject matter experts
Step: 2 Unlock
Step: 3 Unlock