

Question: Excel 1 . 1 Data visualization and anlysis can be used to analyze trends in Net Income. Inditex is able to maintain a high and
Excel Data visualization and anlysis can be used to analyze trends in Net
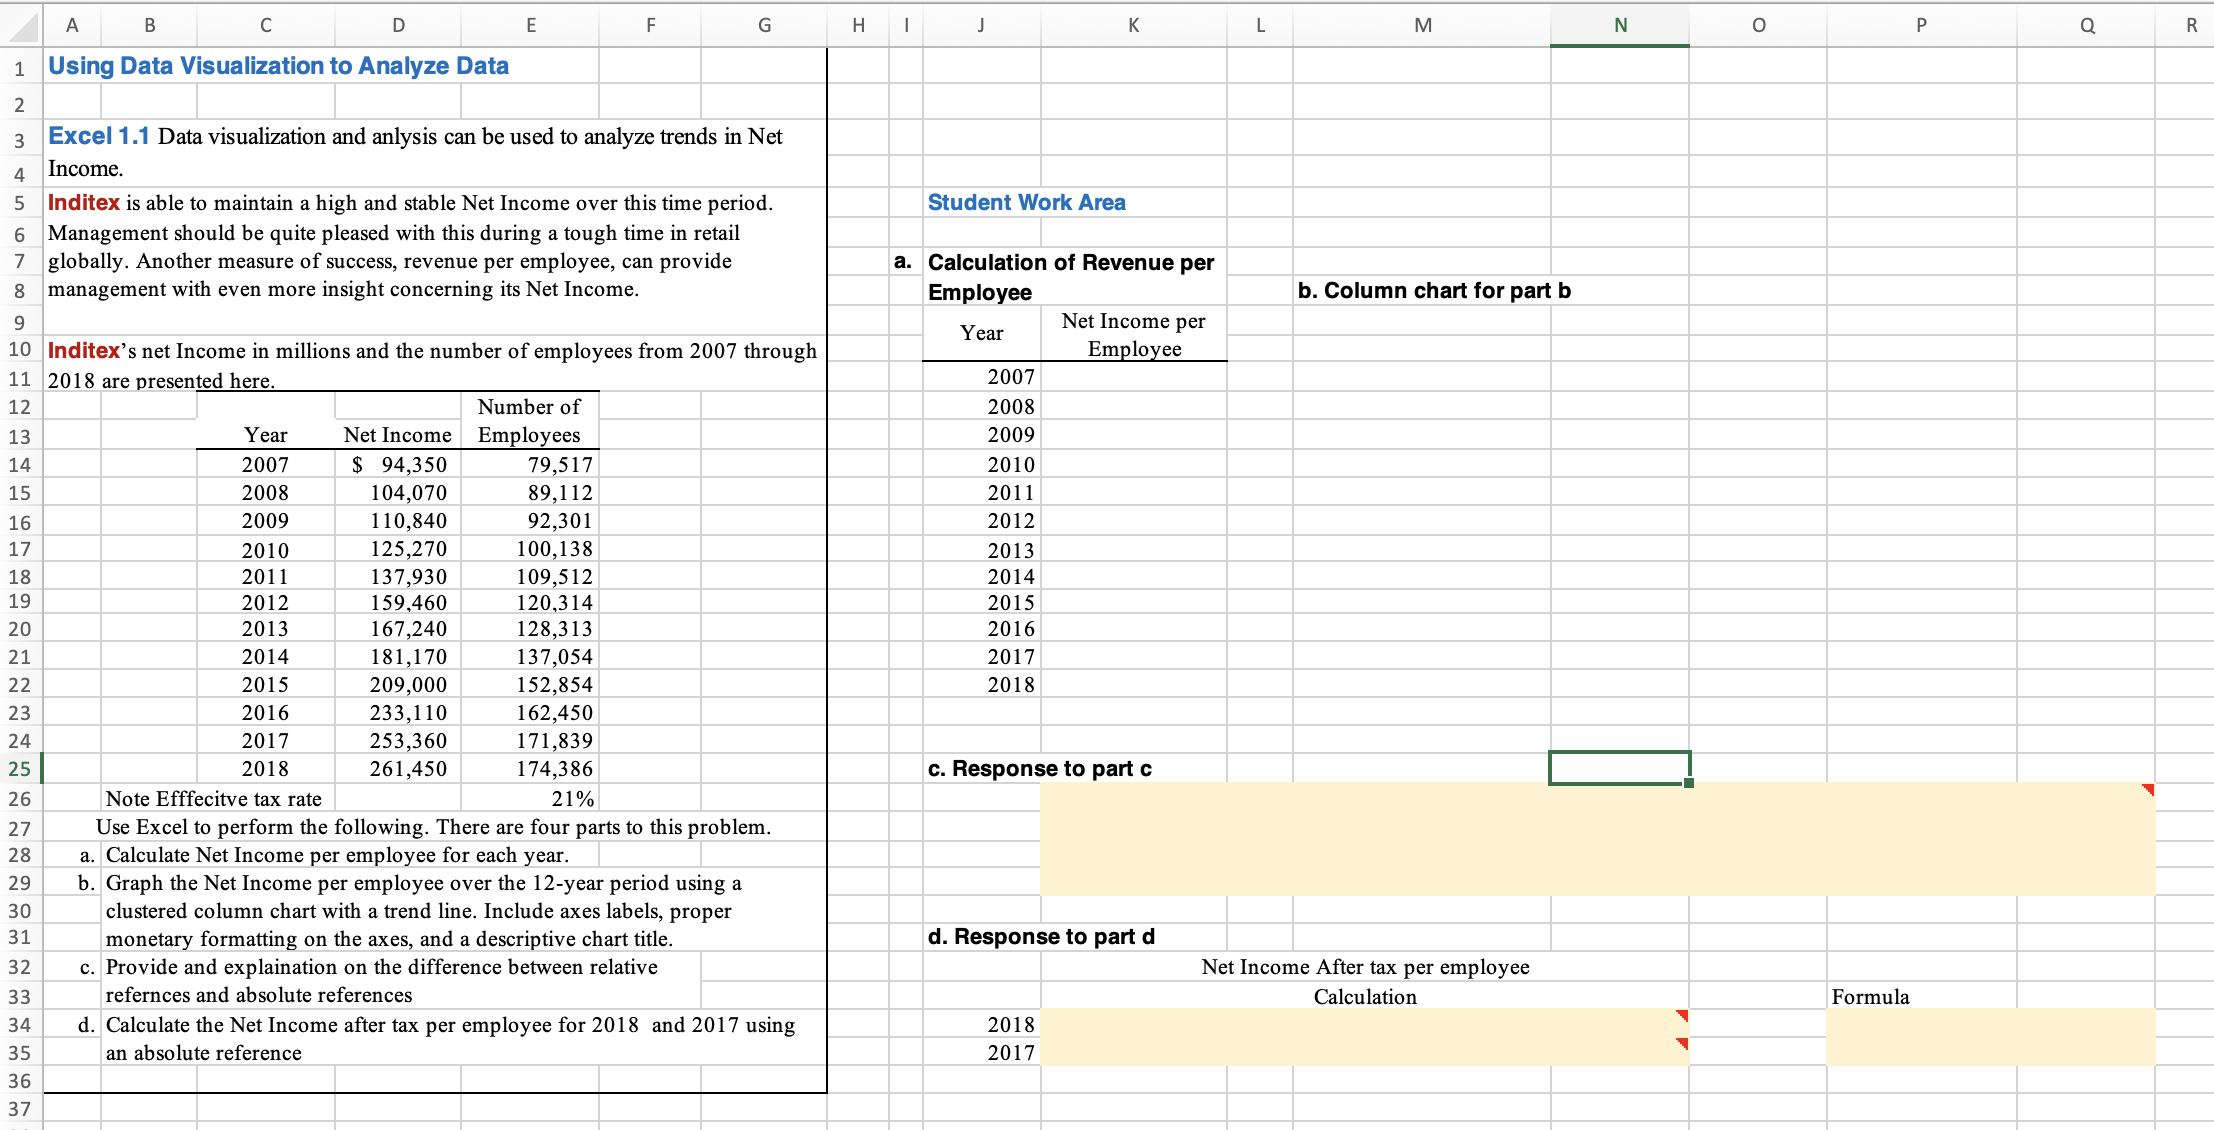
Income.
Inditex is able to maintain a high and stable Net Income over this time period.
Management should be quite pleased with this during a tough time in retail
globally. Another measure of success, revenue per employee, can provide
management with even more insight concerning its Net Income.
Inditex's net Income in millions and the number of employees from through
are presented here.
Note Efffecitve tax rate
Use Excel to perform the following. There are four parts to this problem.
a Calculate Net Income per employee for each year.
b Graph the Net Income per employee over the year period using a
clustered column chart with a trend line. Include axes labels, proper
monetary formatting on the axes, and a descriptive chart title.
c Provide and explaination on the difference between relative
refernces and absolute references
d Calculate the Net Income after tax per employee for and using
an absolute reference
Step by Step Solution
There are 3 Steps involved in it
1 Expert Approved Answer
Step: 1 Unlock

Question Has Been Solved by an Expert!
Get step-by-step solutions from verified subject matter experts
Step: 2 Unlock
Step: 3 Unlock