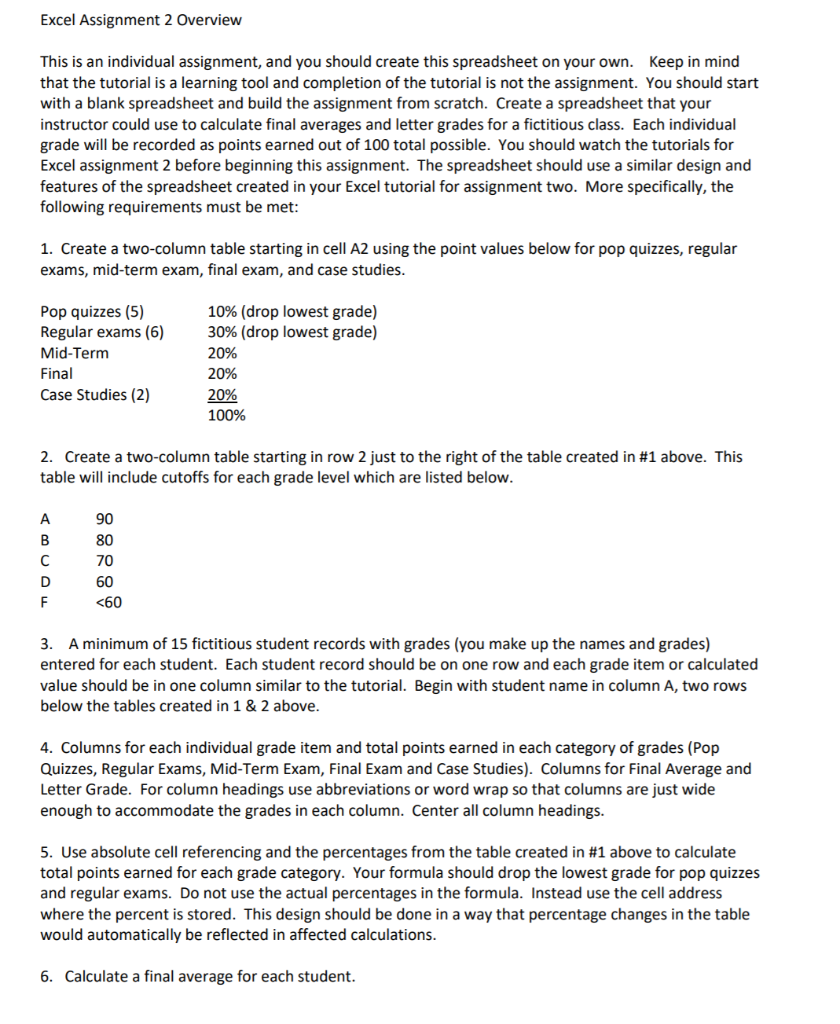
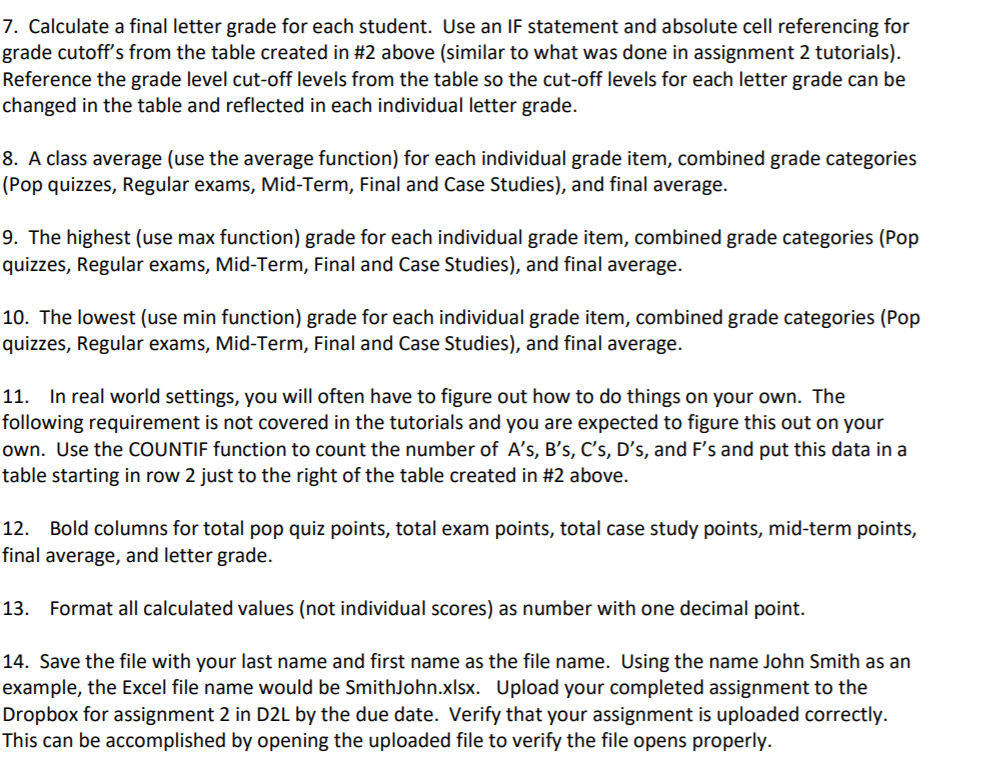
Question: Excel Assignment 2 Overview This is an individual assignment, and you should create this spreadsheet on your own. Keep in mind that the tutorial is

Excel Assignment 2 Overview This is an individualExcel Assignment 2 Overview This is an individualExcel Assignment 2 Overview This is an individual

Excel Assignment 2 Overview This is an individual assignment, and you should create this spreadsheet on your own. Keep in mind that the tutorial is a learning tool and completion of the tutorial is not the assignment. You should start with a blank spreadsheet and build the assignment from scratch. Create a spreadsheet that your instructor could use to calculate final averages and letter grades for a fictitious class. Each individual grade will be recorded as points earned out of 100 total possible. You should watch the tutorials for Excel assignment 2 before beginning this assignment. The spreadsheet should use a similar design and features of the spreadsheet created in your Excel tutorial for assignment two. More specifically, the following requirements must be met: 1. Create a two-column table starting in cell A2 using the point values below for pop quizzes, regular exams, mid-term exam, final exam, and case studies. 10% (drop lowest grade) 30% (drop lowest grade) Pop quizzes (5) Regular exams (6) Mid-Term Final Case Studies (2) 20% 20% 20% 100% 2. Create a two-column table starting in row 2 just to the right of the table created in #1 above. This table will include cutoffs for each grade level which are listed below. A B 90 80 70 60

Step by Step Solution

There are 3 Steps involved in it

1 Expert Approved Answer
Step: 1 Unlock blur-text-image
Question Has Been Solved by an Expert!

Get step-by-step solutions from verified subject matter experts

Step: 2 Unlock
Step: 3 Unlock

Students Have Also Explored These Related General Management Questions!