

Question: Excel Case # 1 ALL numerical answers you input should be cell references, NOT hardkeyed / typed - in numbers. Data Inputs: Format per unit
Excel Case #
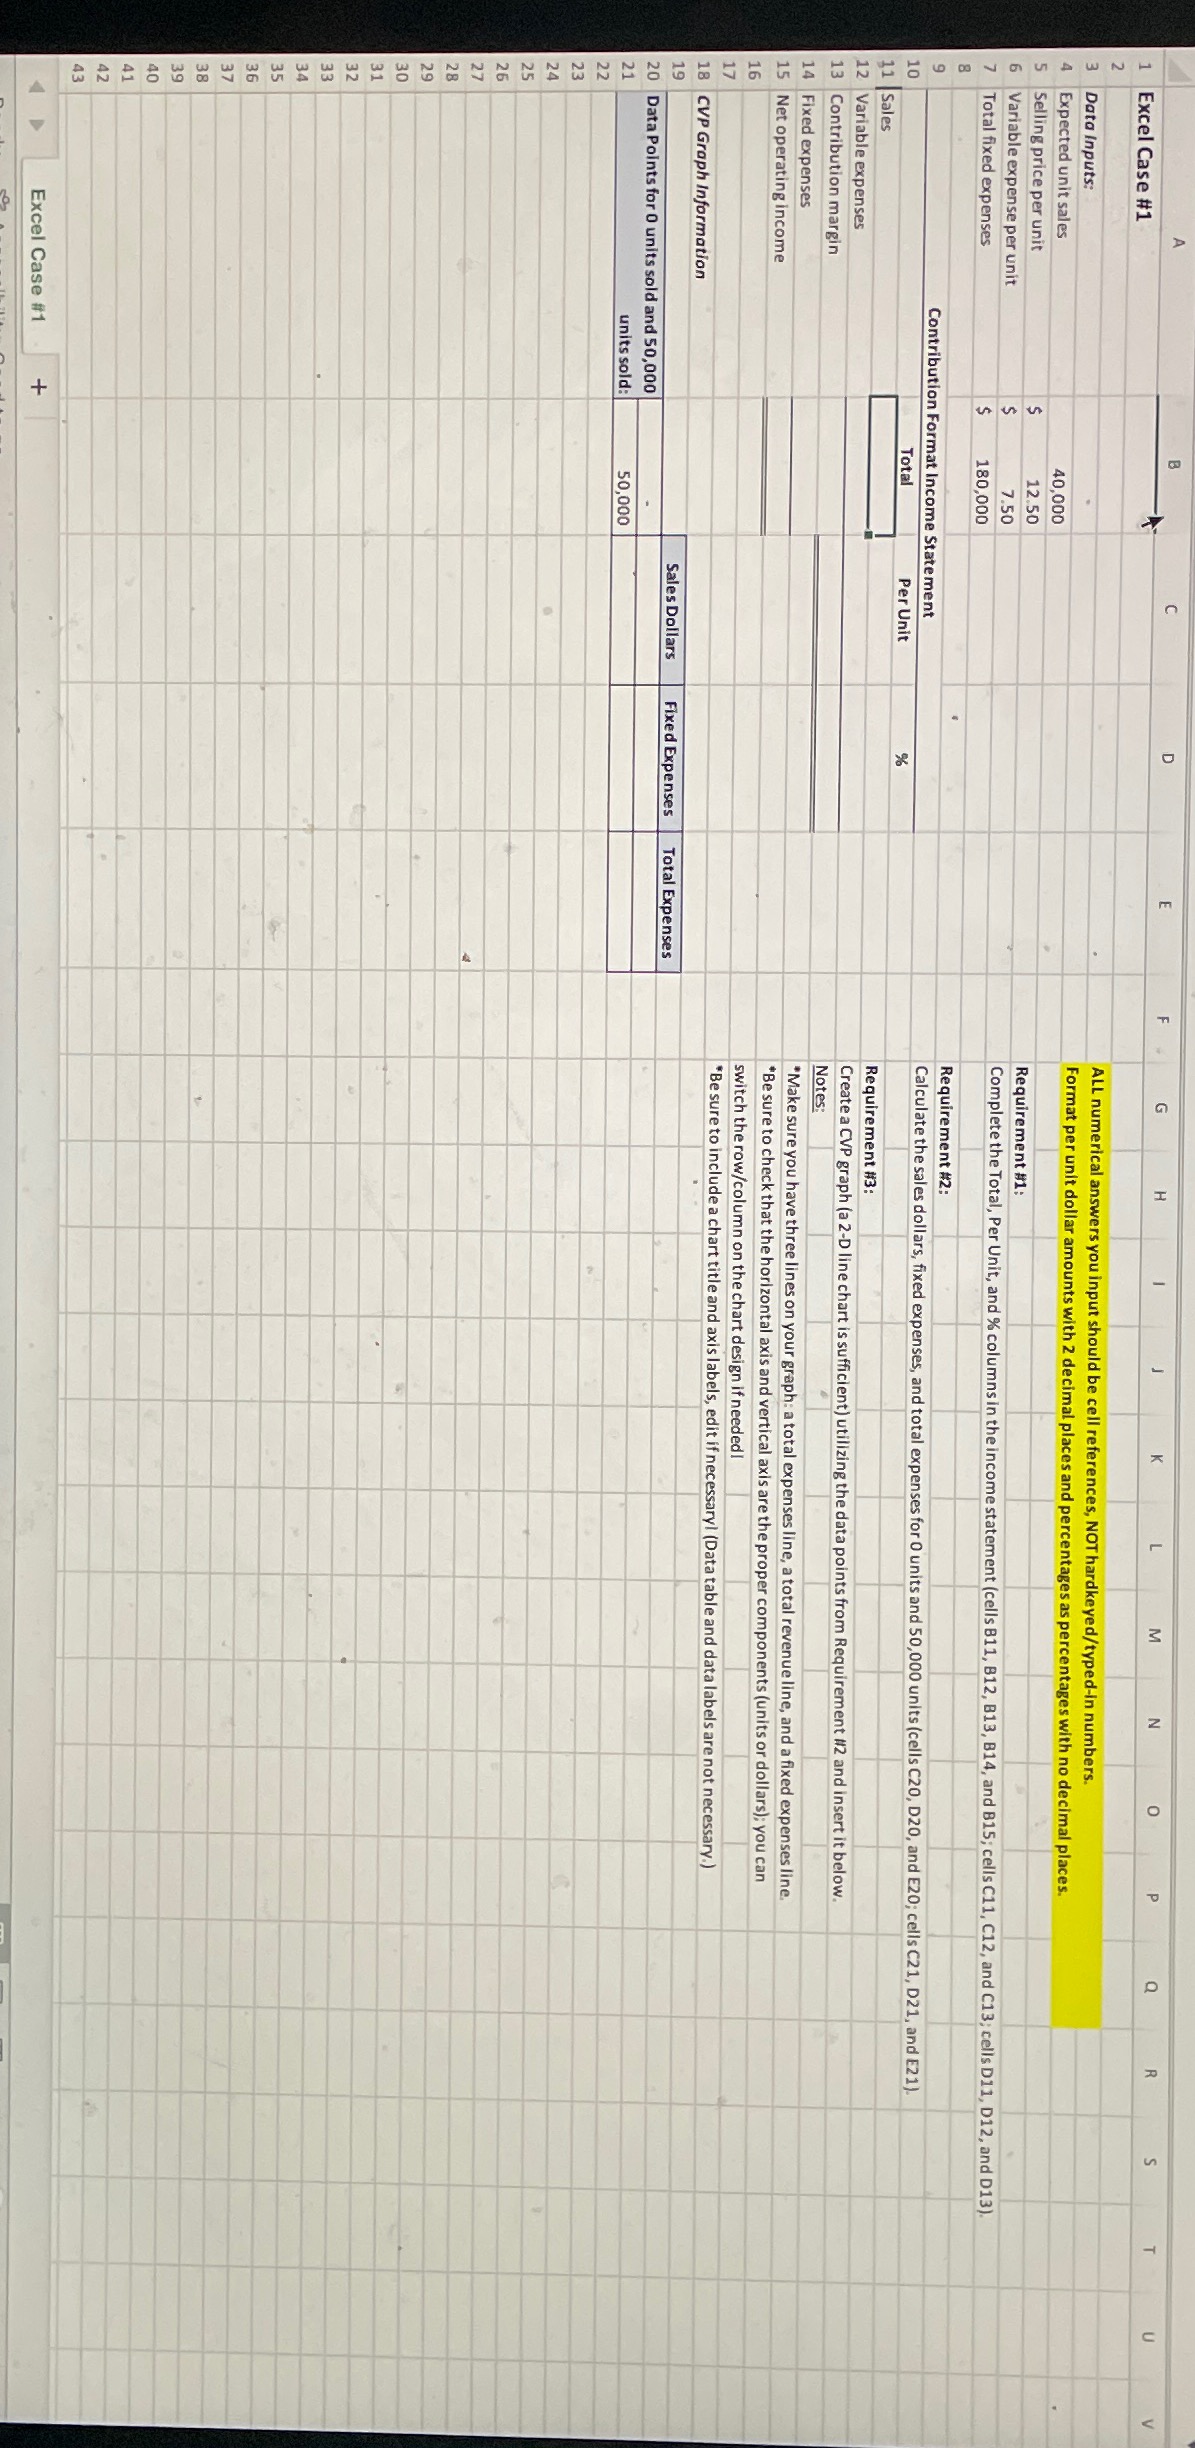
ALL numerical answers you input should be cell references, NOT hardkeyedtypedin numbers.
Data Inputs: Format per unit dollar amounts with decimal places and percentages as percentages with no decimal places.
Expected unit sales
Selling price per unit $ Requirement #:
Variable expense per unit $ Complete the Total, Per Unit, and columns in the income statement cells B B B B and B; cells C C and C; cells D D and D
Total fixed expenses $
Requirement #:
Contribution Format Income Statement Calculate the sales dollars, fixed expenses, and total expenses for units and units cells C D and E; cells C D and E
Total Per Unit
Sales $ $ Requirement #:
Variable expenses Create a CVP graph a D line chart is sufficient utilizing the data points from Requirement # and insert it below.
Contribution margin $ Notes:
Fixed expenses Make sure you have three lines on your graph: a total expenses line, a total revenue line, and a fixed expenses line.
Net operating income $Be sure to check that the horizontal axis and vertical axis are the proper components units or dollars; you can
switch the rowcolumn on the chart design if needed!
Be sure to include a chart title and axis labels, edit if necessary! Data table and data labels are not necessary.
CVP Graph Information
Sales Dollars Fixed Expenses Total Expenses
Data Points for units sold and units sold: $ $
$ $Excel Case #
Data Inputs:
Expected unit sales
Selling price per unit
Variable expense per unit
Total fixed expenses
Sales
Variable expenses
Contribution margin
Fixed expenses
Net operating income
CVP Graph Information
ALL numerical answers you input should be cell references, NOT hardkeyedtypedin numbers.
Format per unit dollar amounts with decimal places and percentages as percentages with no decimal places.
Requirement
Complete the Total, Per Unit, and columns in the income statement cells B B B B and B; cells C C and C; cells D D and D
Requirement # :
Calculate the sales dollars, fixed expenses, and total expenses for units and units cells C D and E; cells C D and E
Requirement H:
Create a CVP graph a D line chart is sufficient utilizing the data points from Requirement and insert it below.
Notes:
Make sure you have three lines on your graph: a total expenses line, a total revenue line, and a fixed expenses line.
Be sure to check that the horizontal axis and vertical axis are the proper components units or dollars; you can
switch the rowcolumn on the chart design if needed I
Be sure to include a chart title and axis labels, edit if necessaryl Data table and data labels are not necessary.
Step by Step Solution
There are 3 Steps involved in it
1 Expert Approved Answer
Step: 1 Unlock

Question Has Been Solved by an Expert!
Get step-by-step solutions from verified subject matter experts
Step: 2 Unlock
Step: 3 Unlock