

Question: Excel Data is: From To Ship Capacity Supply/Demand Texas New Orleans 11 Texas Charleston 7 Texas Seattle 2 Texas St. Louis 8 California New Orleans
Excel Data is:
| From | To | Ship | Capacity | Supply/Demand | |||||
| Texas | New Orleans | 11 | |||||||
| Texas | Charleston | 7 | |||||||
| Texas | Seattle | 2 | |||||||
| Texas | St. Louis | 8 | |||||||
| California | New Orleans | 5 | 0 | ||||||
| California | Charleston | 4 | 0 | ||||||
| California | Seattle | 8 | 0 | ||||||
| California | St. Louis | 7 | 0 | ||||||
| Alaska | New Orleans | 7 | |||||||
| Alaska | Charleston | 3 | |||||||
| Alaska | Seattle | 12 | |||||||
| Alaska | St. Louis | 6 | |||||||
| Middle East | New Orleans | 8 | |||||||
| Middle East | Charleston | 9 | |||||||
| Middle East | Seattle | 4 | |||||||
| Middle East | St. Louis | 15 | |||||||
| New Orleans | Pittsburgh | 5 | |||||||
| New Orleans | Atlanta | 9 | |||||||
| New Orleans | Kansas City | 6 | |||||||
| New Orleans | San Francisco | 4 | |||||||
| Charleston | Pittsburgh | 8 | |||||||
| Charleston | Atlanta | 7 | |||||||
| Charleston | Kansas City | 9 | |||||||
| Charleston | San Francisco | 5 | |||||||
| Seattle | Pittsburgh | 4 | |||||||
| Seattle | Atlanta | 6 | |||||||
| Seattle | Kansas City | 7 | |||||||
| Seattle | San Francisco | 8 | |||||||
| St. Louis | Pittsburgh | 12 | |||||||
| St. Louis | Atlanta | 11 | |||||||
| St. Louis | Kansas City | 9 | |||||||
| St. Louis | San Francisco | 7 |
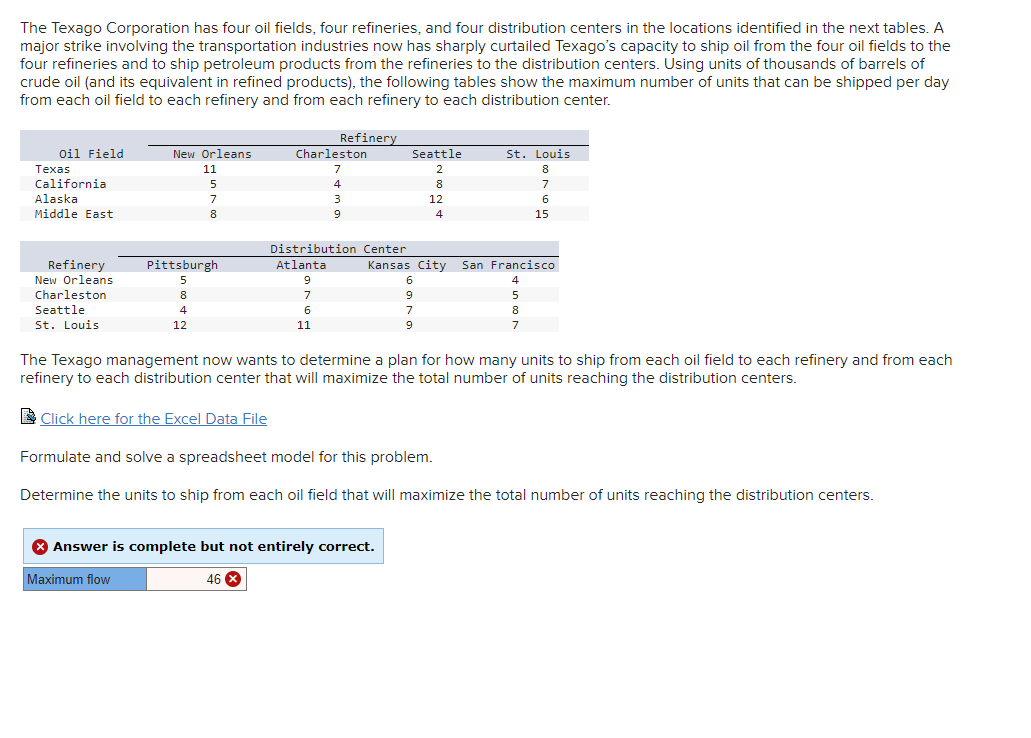
The Texago Corporation has four oil fields, four refineries, and four distribution centers in the locations identified in the next tables. A major strike involving the transportation industries now has sharply curtailed Texago's capacity to ship oil from the four oil fields to the four refineries and to ship petroleum products from the refineries to the distribution centers. Using units of thousands of barrels of crude oil (and its equivalent in refined products), the following tables show the maximum number of units that can be shipped per day from each oil field to each refinery and from each refinery to each distribution center. The Texago management now wants to determine a plan for how many units to ship from each oil field to each refinery and from each refinery to each distribution center that will maximize the total number of units reaching the distribution centers. Click here for the Excel Data File Formulate and solve a spreadsheet model for this problem. Determine the units to ship from each oil field that will maximize the total number of units reaching the distribution centers
Step by Step Solution
There are 3 Steps involved in it

Get step-by-step solutions from verified subject matter experts