

Question: Excel Data is here Project 1 Project 2 Project 3 Project 4 Project 5 Estimated Profit 1 1.8 1.6 0.8 1.4 ($million) Capital Available Capital
Excel Data is here
| Project 1 | Project 2 | Project 3 | Project 4 | Project 5 | ||||
| Estimated Profit | 1 | 1.8 | 1.6 | 0.8 | 1.4 | |||
| ($million) | Capital | |||||||
| Available | ||||||||
| Capital Required for Project ($million) | ($million) | |||||||
| Capital | 6 | 12 | 10 | 4 | 8 | 20 |
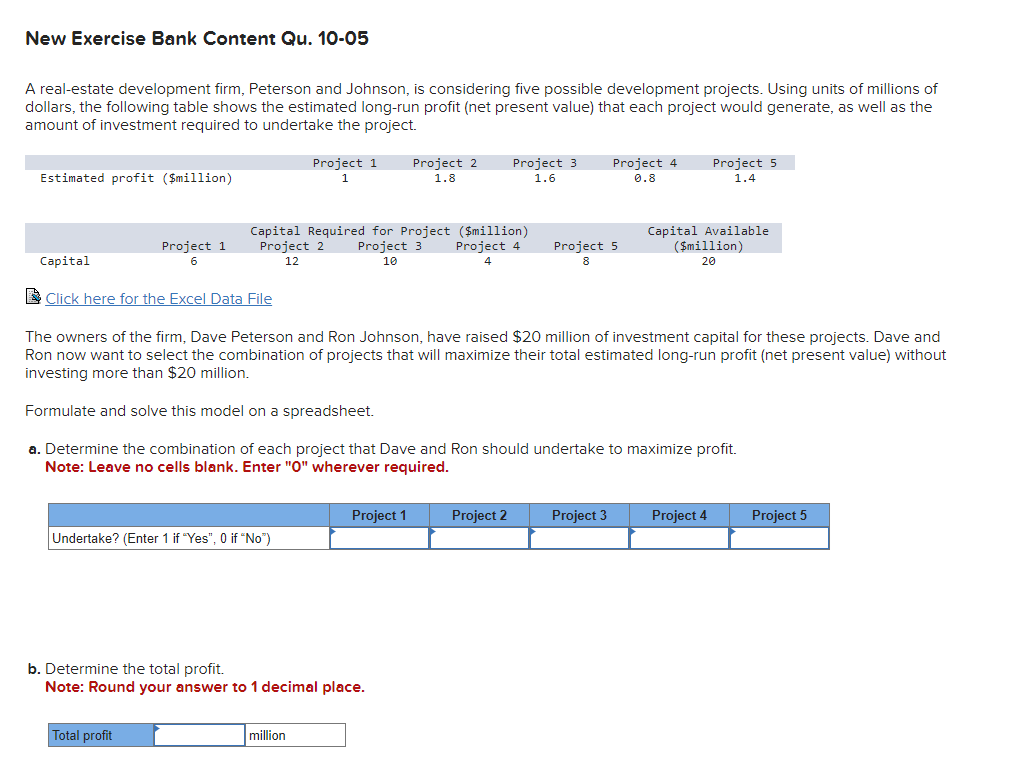
A real-estate development firm, Peterson and Johnson, is considering five possible development projects. Using units of millions of dollars, the following table shows the estimated long-run profit (net present value) that each project would generate, as well as the amount of investment required to undertake the project. Click here for the Excel Data File The owners of the firm, Dave Peterson and Ron Johnson, have raised $20 million of investment capital for these projects. Dave and Ron now want to select the combination of projects that will maximize their total estimated long-run profit (net present value) without investing more than $20 million. Formulate and solve this model on a spreadsheet. a. Determine the combination of each project that Dave and Ron should undertake to maximize profit. Note: Leave no cells blank. Enter " 0 " wherever required. b. Determine the total profit. Note: Round your answer to 1 decimal place
Step by Step Solution
There are 3 Steps involved in it

Get step-by-step solutions from verified subject matter experts