

Question: Excel Data (Power Data from Refresh Stocks Currencies Geography Automatic J Sort Filter Text to What-If Query Picture All Edit Links Advanced Columns Analysis 2
Excel
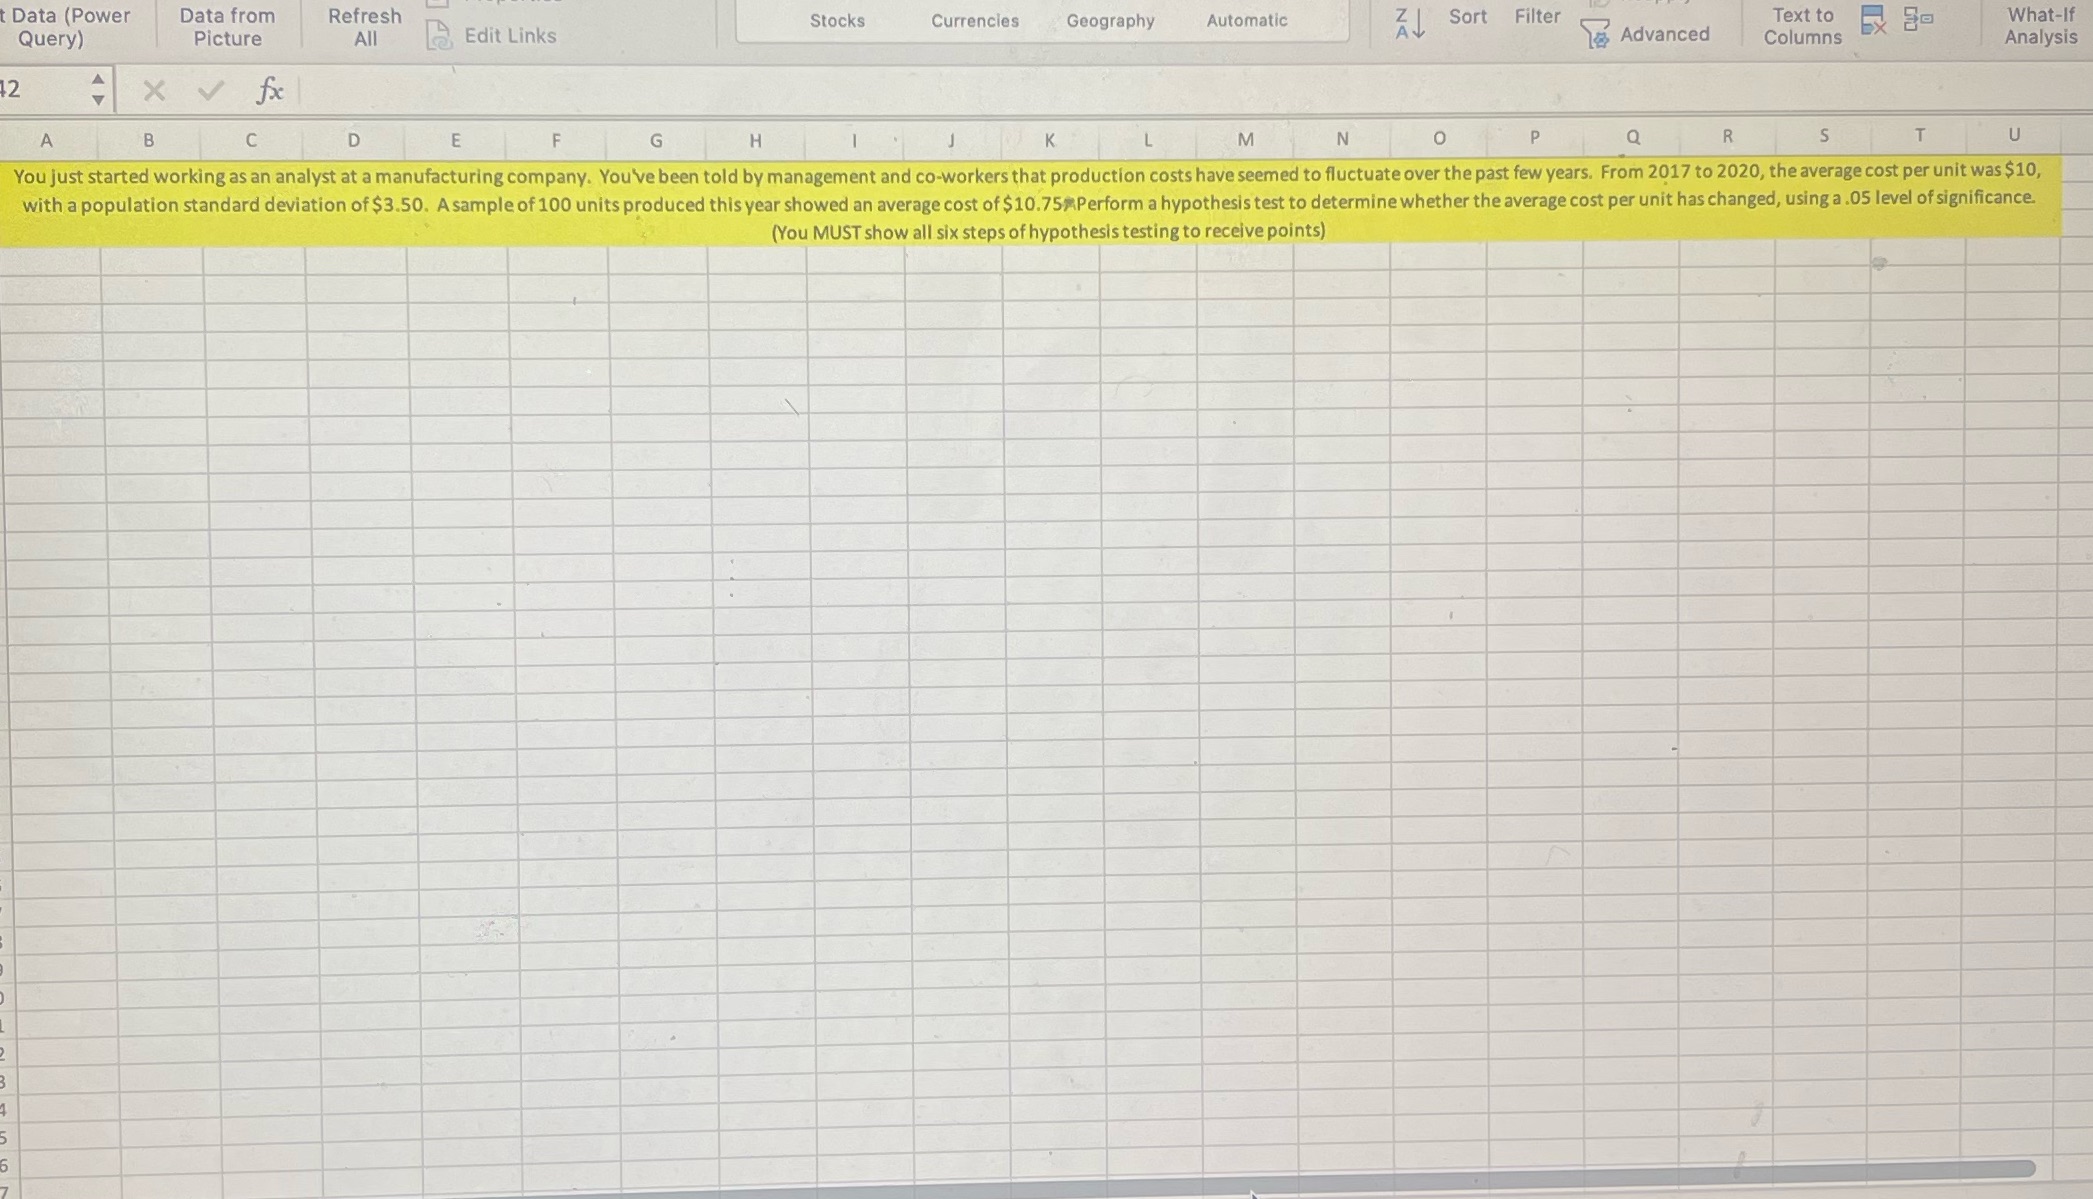
Data (Power Data from Refresh Stocks Currencies Geography Automatic J Sort Filter Text to What-If Query Picture All Edit Links Advanced Columns Analysis 2 X V fx A B C D E F G H K M N 0 P Q R S U You just started working as an analyst at a manufacturing company. You've been told by management and co-workers that production costs have seemed to fluctuate over the past few years. From 2017 to 2020, the average cost per unit was $10, with a population standard deviation of $3.50. Asample of 100 units produced this year showed an average cost of $10.75/Perform a hypothesis test to determine whether the average cost per unit has changed, using a .05 level of significance. (You MUST show all six steps of hypothesis testing to receive points)
Step by Step Solution
There are 3 Steps involved in it

Get step-by-step solutions from verified subject matter experts