

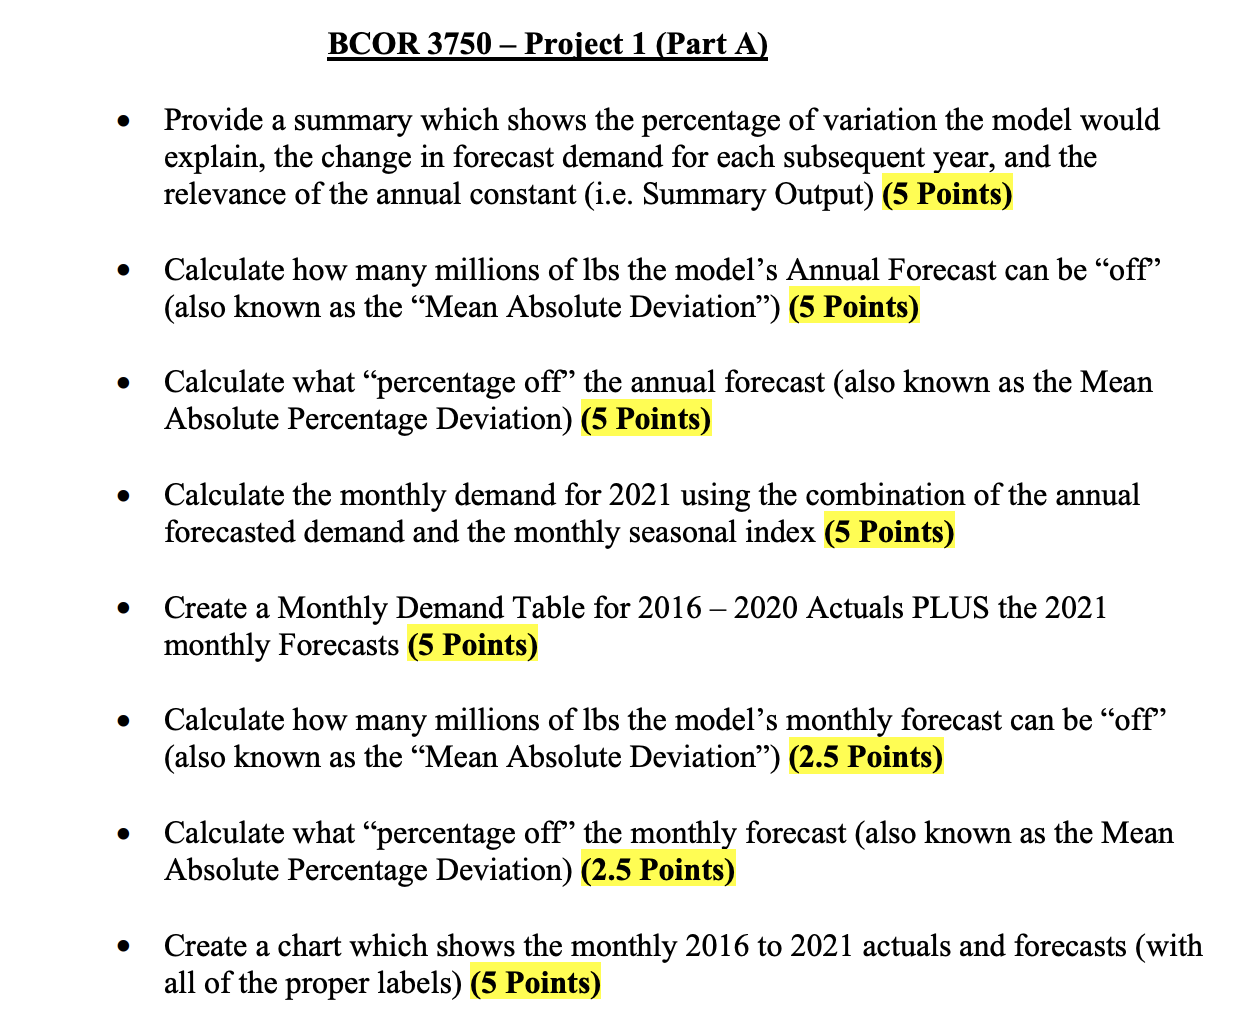
Question: excel file BCOR 3750 -- Operations and Supply Chain Management Analytics Project 1A -- Forecasting NutCo Historical Shipments from 2016 to 2020 (MM Lbs) Year
excel file
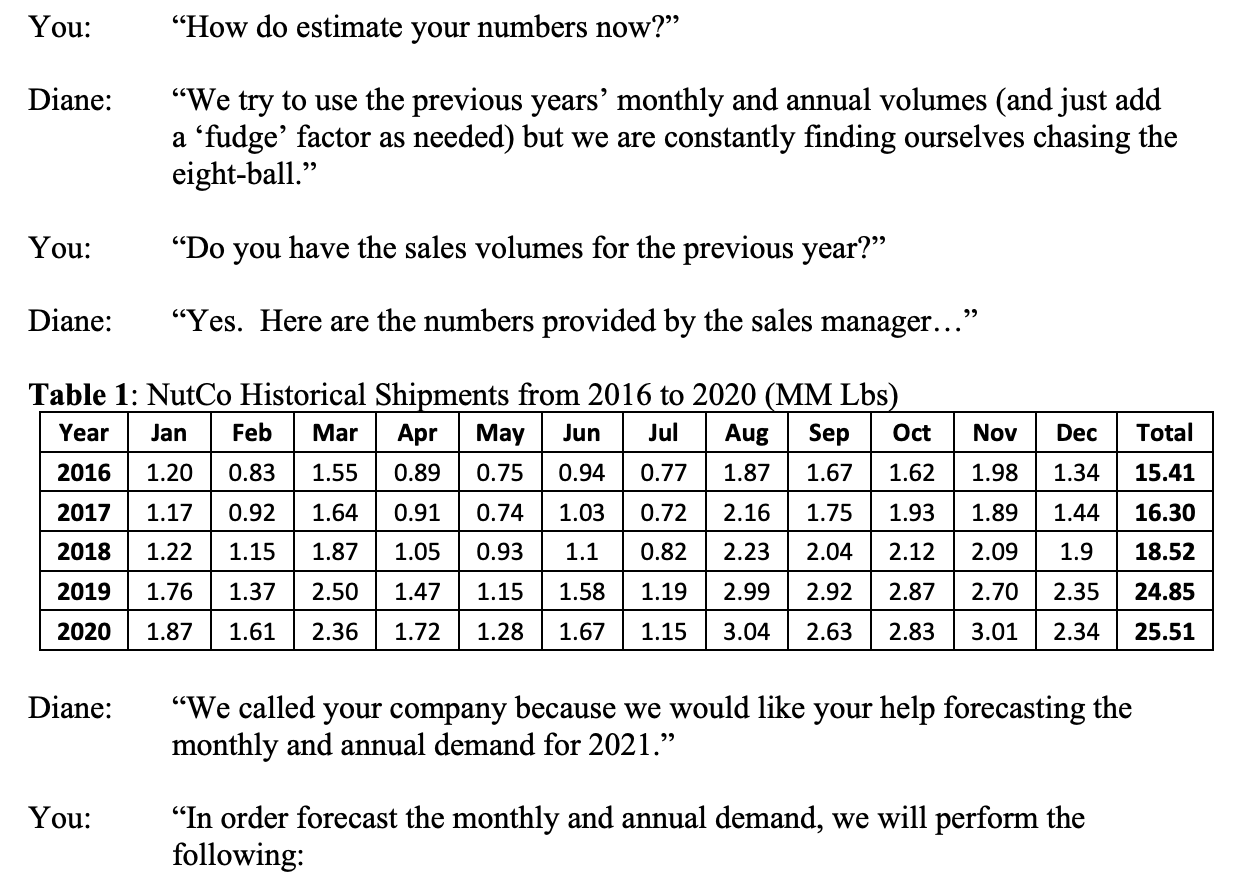
| BCOR 3750 -- Operations and Supply Chain Management Analytics | |||||||
| Project 1A -- Forecasting | |||||||
| NutCo Historical Shipments from 2016 to 2020 (MM Lbs) | |||||||
| Year | 2016 | 2017 | 2018 | 2019 | 2020 | 2021 | |
| Jan | 1.2 | 1.2 | 1.2 | 1.8 | 1.9 | ||
| Feb | 0.8 | 0.9 | 1.1 | 1.4 | 1.6 | ||
| Mar | 1.5 | 1.6 | 1.9 | 2.5 | 2.4 | ||
| Apr | 0.9 | 0.9 | 1.0 | 1.5 | 1.7 | ||
| May | 0.8 | 0.7 | 0.9 | 1.1 | 1.3 | ||
| Jun | 0.9 | 1.0 | 1.1 | 1.6 | 1.7 | ||
| Jul | 0.8 | 0.7 | 0.8 | 1.2 | 1.1 | ||
| Aug | 1.9 | 2.2 | 2.2 | 3.0 | 3.0 | ||
| Sep | 1.7 | 1.8 | 2.0 | 2.9 | 2.6 | ||
| Oct | 1.6 | 1.9 | 2.1 | 2.9 | 2.8 | ||
| Nov | 2.0 | 1.9 | 2.1 | 2.7 | 3.0 | ||
| Dec | 1.3 | 1.4 | 1.9 | 2.3 | 2.3 | ||
| Total | 15.4 | 16.3 | 18.5 | 24.8 | 25.5 | ||
Step by Step Solution
There are 3 Steps involved in it
1 Expert Approved Answer
Step: 1 Unlock

Question Has Been Solved by an Expert!
Get step-by-step solutions from verified subject matter experts
Step: 2 Unlock
Step: 3 Unlock