

Question: Excel Formulas please Question 2 Make a Fishbone diagram reflecting possible causes affecting the highest incidence repair / defect captured on the data above. When
Excel Formulas please
Question
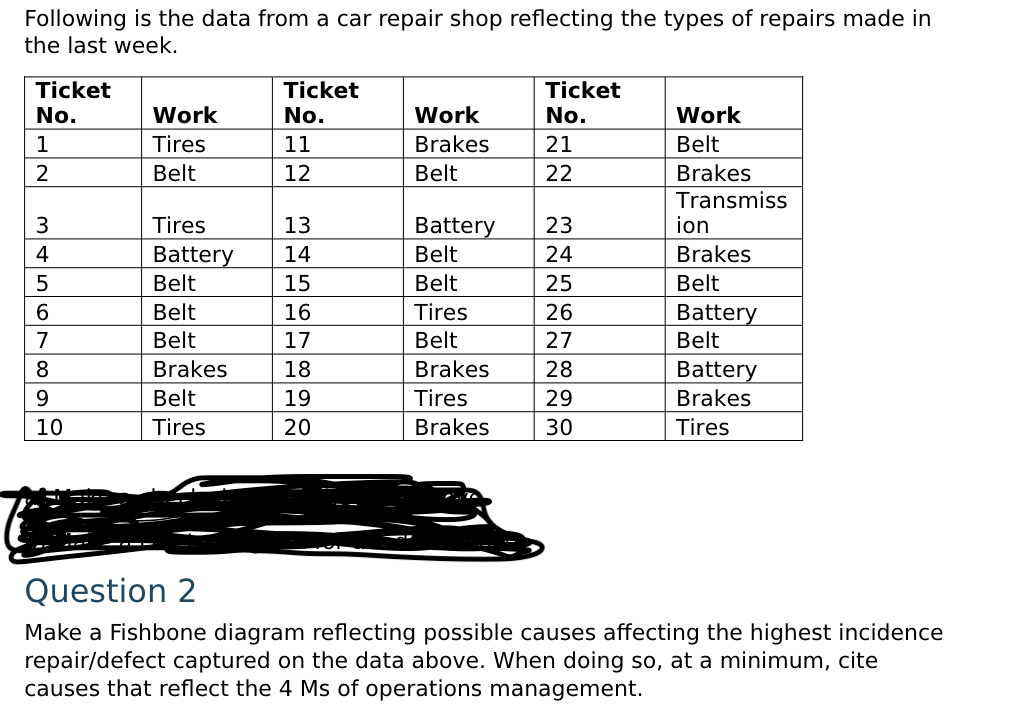
Make a Fishbone diagram reflecting possible causes affecting the highest incidence
repairdefect captured on the data above. When doing so at a minimum, cite
causes that reflect the Ms of operations management.
Step by Step Solution
There are 3 Steps involved in it
1 Expert Approved Answer
Step: 1 Unlock

Question Has Been Solved by an Expert!
Get step-by-step solutions from verified subject matter experts
Step: 2 Unlock
Step: 3 Unlock