

Question: Please answer question # 2 . Please answer using Excel and kindly show all the work on how you got the answer. I much appreciate
Please answer question # Please answer using Excel and kindly show all the work on how you got the answer. I much appreciate your help.
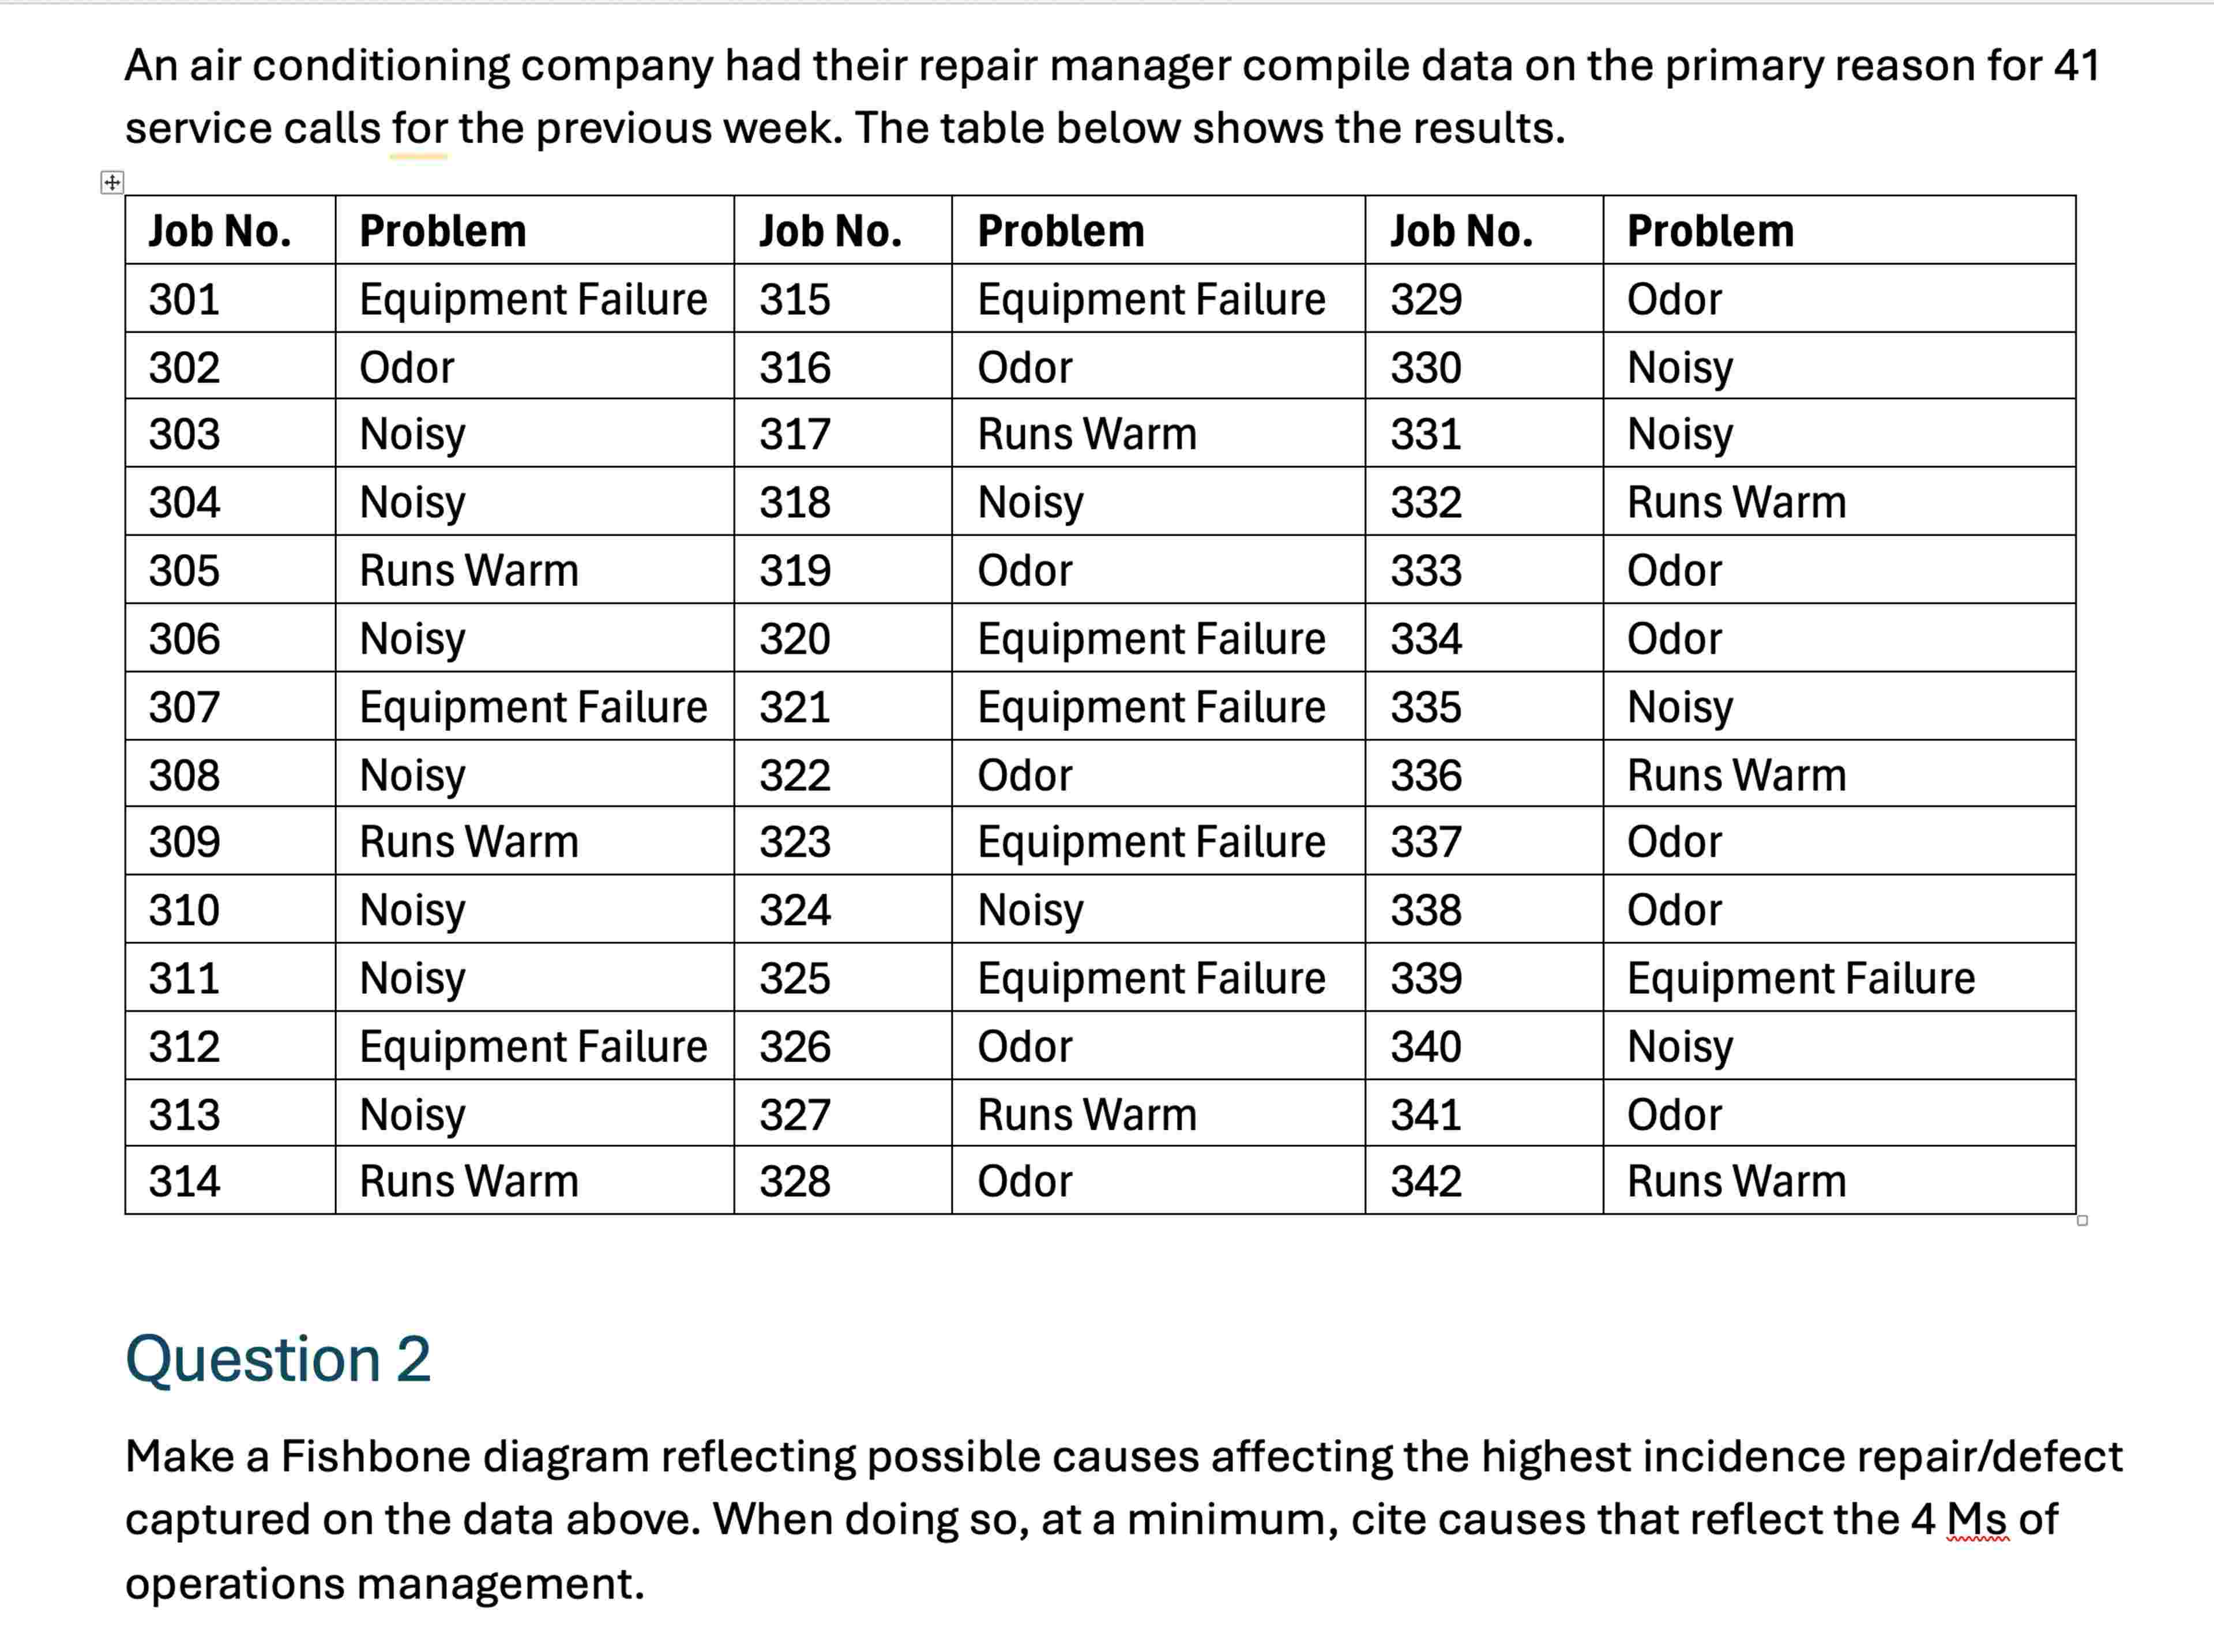
An air conditioning company had their repair manager compile data on the primary reason for service calls for the previous week. The table below shows the results.
Job No Problem Job No Problem Job No Problem Equipment Failure Equipment Failure Odor Odor Odor Noisy Noisy Runs Warm Noisy Noisy Noisy Runs Warm Runs Warm Odor Odor Noisy Equipment Failure Odor Equipment Failure Equipment Failure Noisy Noisy Odor Runs Warm Runs Warm Equipment Failure Odor Noisy Noisy Odor Noisy Equipment Failure Equipment Failure Equipment Failure Odor Noisy Noisy Runs Warm Odor Runs Warm Odor Runs Warm
Question
Make a Fishbone diagram reflecting possible causes affecting the highest incidence repairdefect captured on the data above. When doing so at a minimum, cite causes that reflect the Ms of operations management.
Step by Step Solution
There are 3 Steps involved in it
1 Expert Approved Answer
Step: 1 Unlock

Question Has Been Solved by an Expert!
Get step-by-step solutions from verified subject matter experts
Step: 2 Unlock
Step: 3 Unlock