

Question: Excel Group Project Introduction NYP , New Y ork Paper Co . , is using itsfinancial results for August 2 0 1 9
Excel Group Project
Introduction
NYP New Y ork Paper Co is using itsfinancial results for August Table as a base for projecting
the comparry's budget for the remaining four months of the year SeptemberDecember
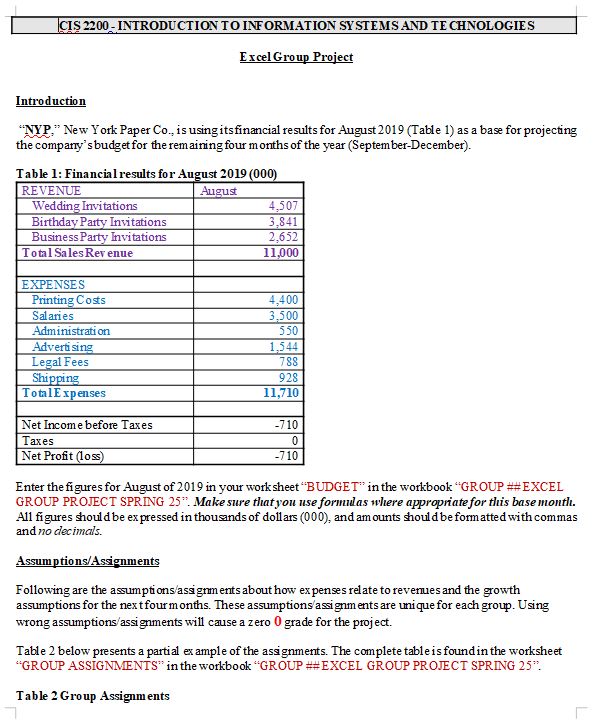
Table : Financial results for August
Enter the figures for August of in your worksheet "BUDGET" in the workbook "GROUP ##EXCEL
GROUP PROJECT SPRING Make sure that you use formulas where appropriate for this base month.
All figures should be ex pressed in thousands of dollars and amounts should be formatted with commas
and no decimals.
AssumptionsAssignments
Following are the assumptionsassignments about how ex penses relate to revenues and the growth
assumptions for the nex tfour months. These assumptions'assignments are unique for each group. Using
wrong assumptionsassignments will cause a zero grade for the project.
Table below presents a partial ex ample of the assignments. The complete table is found in the worksheet
"GROUP ASSIGNMENTS" in the workbook "GROUP ##EXCEL GROUP PROJECT SPRING
Table Group Assignments
A Forecast the budget for the next four months of SeptDec in a work sheet "BUDGET" in the
workbook "GROUP # EXCEL GROUP PR OJECT SPRING Include a footer on this sheet with the
names of all group members.
B Create a trend chart showing the trend over the entire periodin total sales revenue, total expenses and net
profits. Be sure to select the right graph type andlabel the chart in order to indicate that you are displaying
the results in thousands of dollars. Save the chart in a work sheet "BUDGET" in the workbook "EXCEL
GROUP PROJECT SPRING The chart should not be "embedded" which looks copied with gridlines in
the background but on a new sheet clearly, large and presentable with all properlabels. Similar to the one
below.
C Create a pie chart showing the proportional distribution of ex penses in December. Be sure to label the
chart well. Save the chart in a work sheet "DISTRIBUTION" in the workbook "GROUP ## EXCEL GROUP
PROJEC T SPRING The chart should not be "embedded" whichlooks copied with gridlines in the
background but on a new sheet clearly, large, and presentable with all proper labelssimilar to the one
below:
D After youfinished the budget calculations copy the entire work sheet "BUDGET" to a new work sheet
"SOLVER". To copy OPEN the PASTE option. When it opensup click the icon in the top row, second from
the left.
Your work sheet "SOLVER" should look like:
Use the NET Profit value for December cell G and calculate your objective value for improved
December result. The increase for your group is in column G see Table Group Assignment above
Store the desired value in cell D
Use Excel Solver to manipulate projected growth per month cells C:C to achieve the December goal
calculated and stored in cell D
Save the Solver solution.
Please solve and explain how to do parts AC on this excel project I was assigned.
Step by Step Solution
There are 3 Steps involved in it
1 Expert Approved Answer
Step: 1 Unlock

Question Has Been Solved by an Expert!
Get step-by-step solutions from verified subject matter experts
Step: 2 Unlock
Step: 3 Unlock