

Question: Excel Help Please! This data set represents timber production (in tons) for a small northwest company. a. produce a time series graph of the data
Excel Help Please!
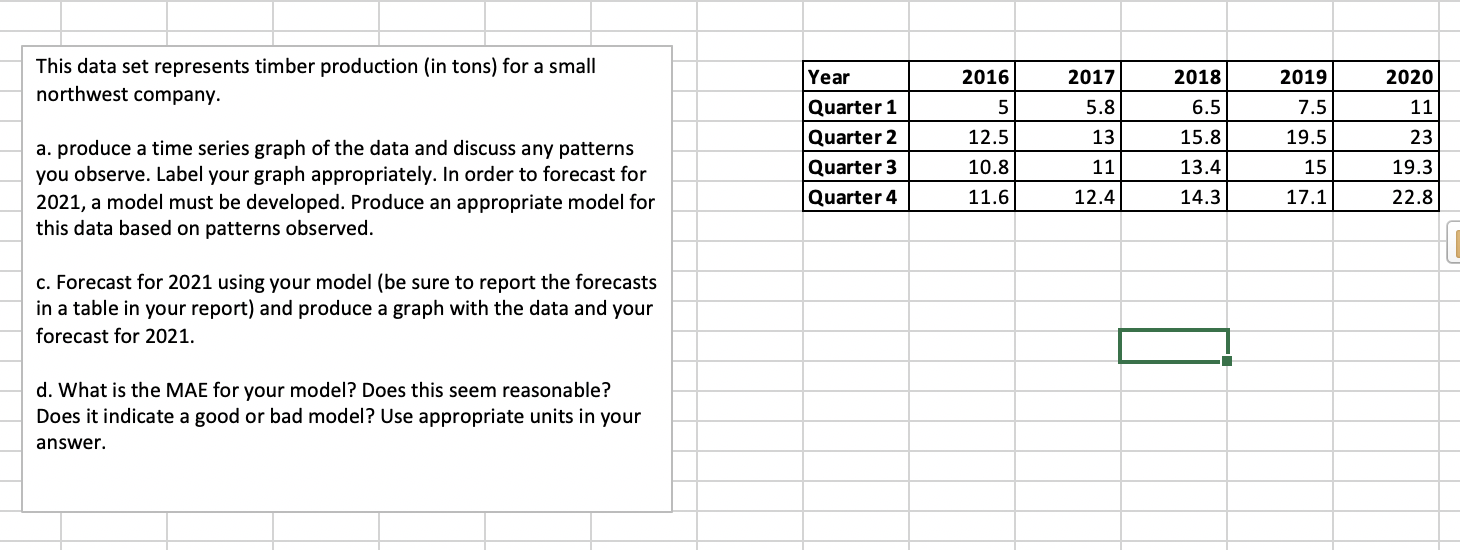
This data set represents timber production (in tons) for a small northwest company. a. produce a time series graph of the data and discuss any patterns you observe. Label your graph appropriately. In order to forecast for 2021, a model must be developed. Produce an appropriate model for this data based on patterns observed. c. Forecast for 2021 using your model (be sure to report the forecasts in a table in your report) and produce a graph with the data and your forecast for 2021. d. What is the MAE for your model? Does this seem reasonable? Does it indicate a good or bad model? Use appropriate units in your answer. mm-m-m-m M'm\" mm M m
Step by Step Solution
There are 3 Steps involved in it

Get step-by-step solutions from verified subject matter experts