

Question: EXCEL MASTER IT! PROBLEM In practice, the use of the dividend discount model is refined from the method we presented in the textbook. Many
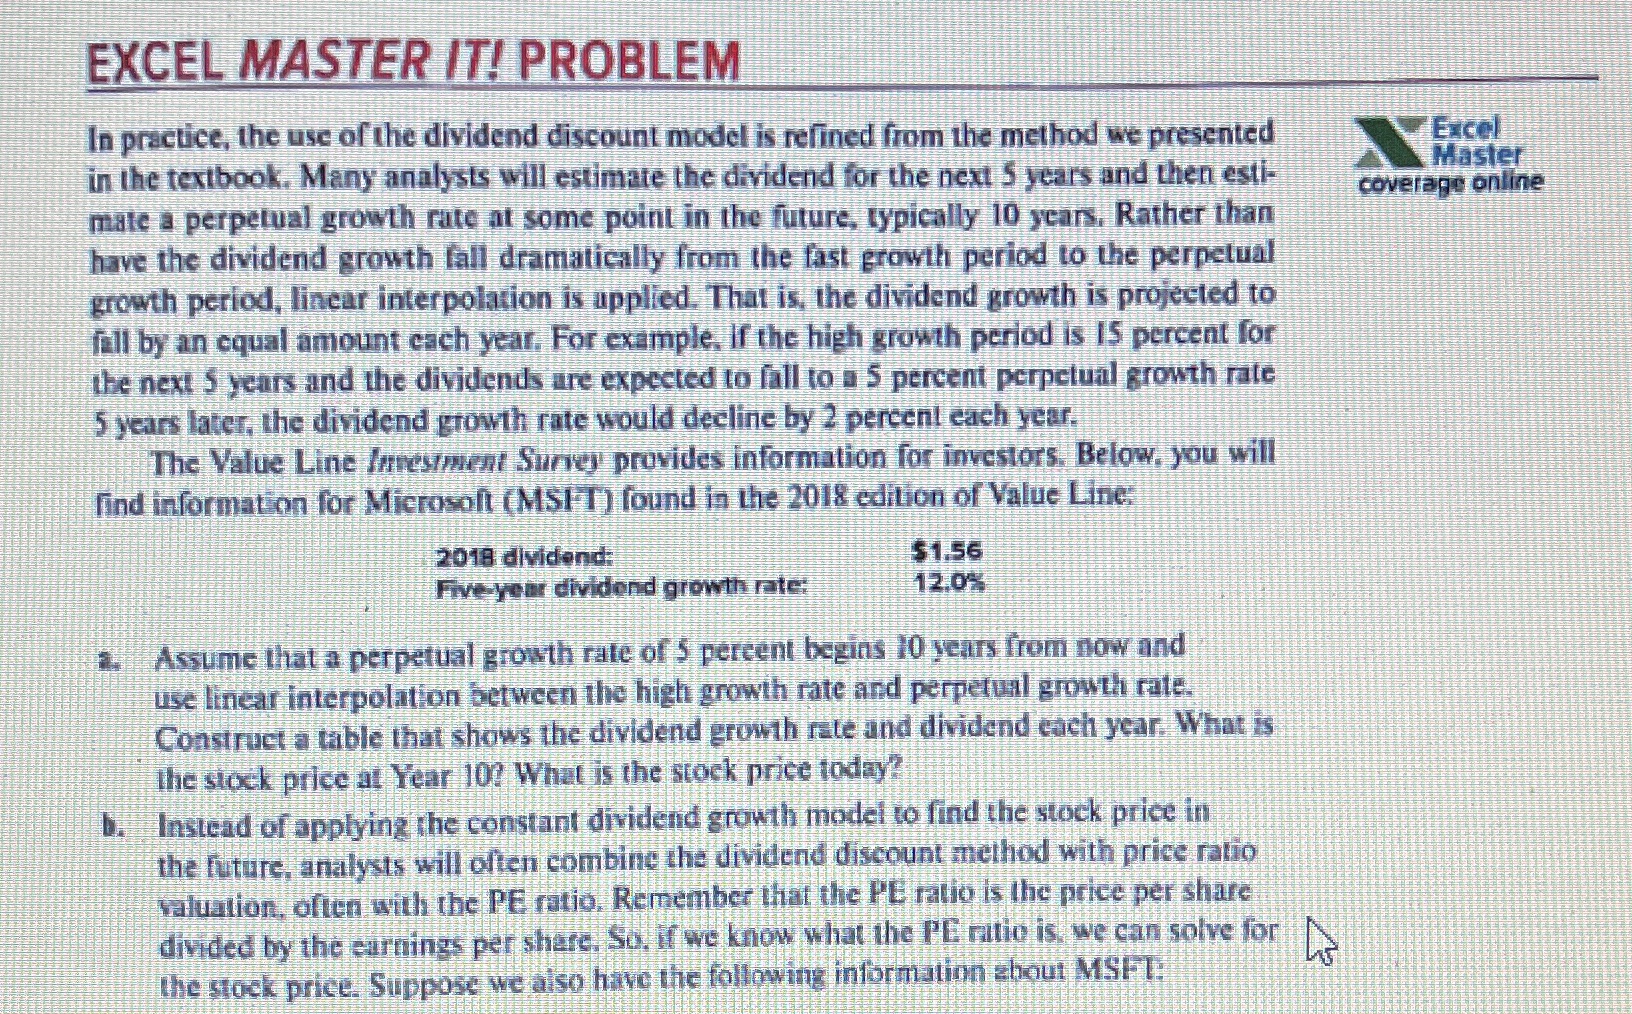
EXCEL MASTER IT! PROBLEM In practice, the use of the dividend discount model is refined from the method we presented in the textbook. Many analysts will estimate the dividend for the next 5 years and then esti- mate a perpetual growth rate at some point in the future, typically 10 years. Rather than have the dividend growth fall dramatically from the fast growth period to the perpetual growth period, linear interpolation is applied. That is, the dividend growth is projected to fall by an equal amount each year. For example, if the high growth period is 15 percent for the next 5 years and the dividends are expected to fall to a 5 percent perpetual growth rate 5 years later, the dividend growth rate would decline by 2 percent each year. The Value Line Investment Survey provides information for investors. Below, you will find information for Microsoft (MSFT) found in the 2018 edition of Value Line: 2018 dividend: Excel Master coverage online Five-year dividend growth rate: $1.56 12.0% Assume that a perpetual growth rate of 5 percent begins 10 years from now and use linear interpolation between the high growth rate and perpetual growth rate. Construct a table that shows the dividend growth rate and dividend each year. What is the stock price at Year 10? What is the stock price today? b. Instead of applying the constant dividend growth model to find the stock price in the future, analysts will often combine the dividend discount method with price ratio valuation, often with the PE ratio. Remember that the PE ratio is the price per share divided by the earnings per share. So, if we know what the PE ratio is, we can solve for the stock price. Suppose we also have the following information about MSFT: 45
Step by Step Solution
There are 3 Steps involved in it

Get step-by-step solutions from verified subject matter experts