

Question: Excel Online Tutorial Excel Online Structured Activity: Level Production Strategy Online file below to develop the level production strategy and answer the following questions. Open
Excel Online Tutorial
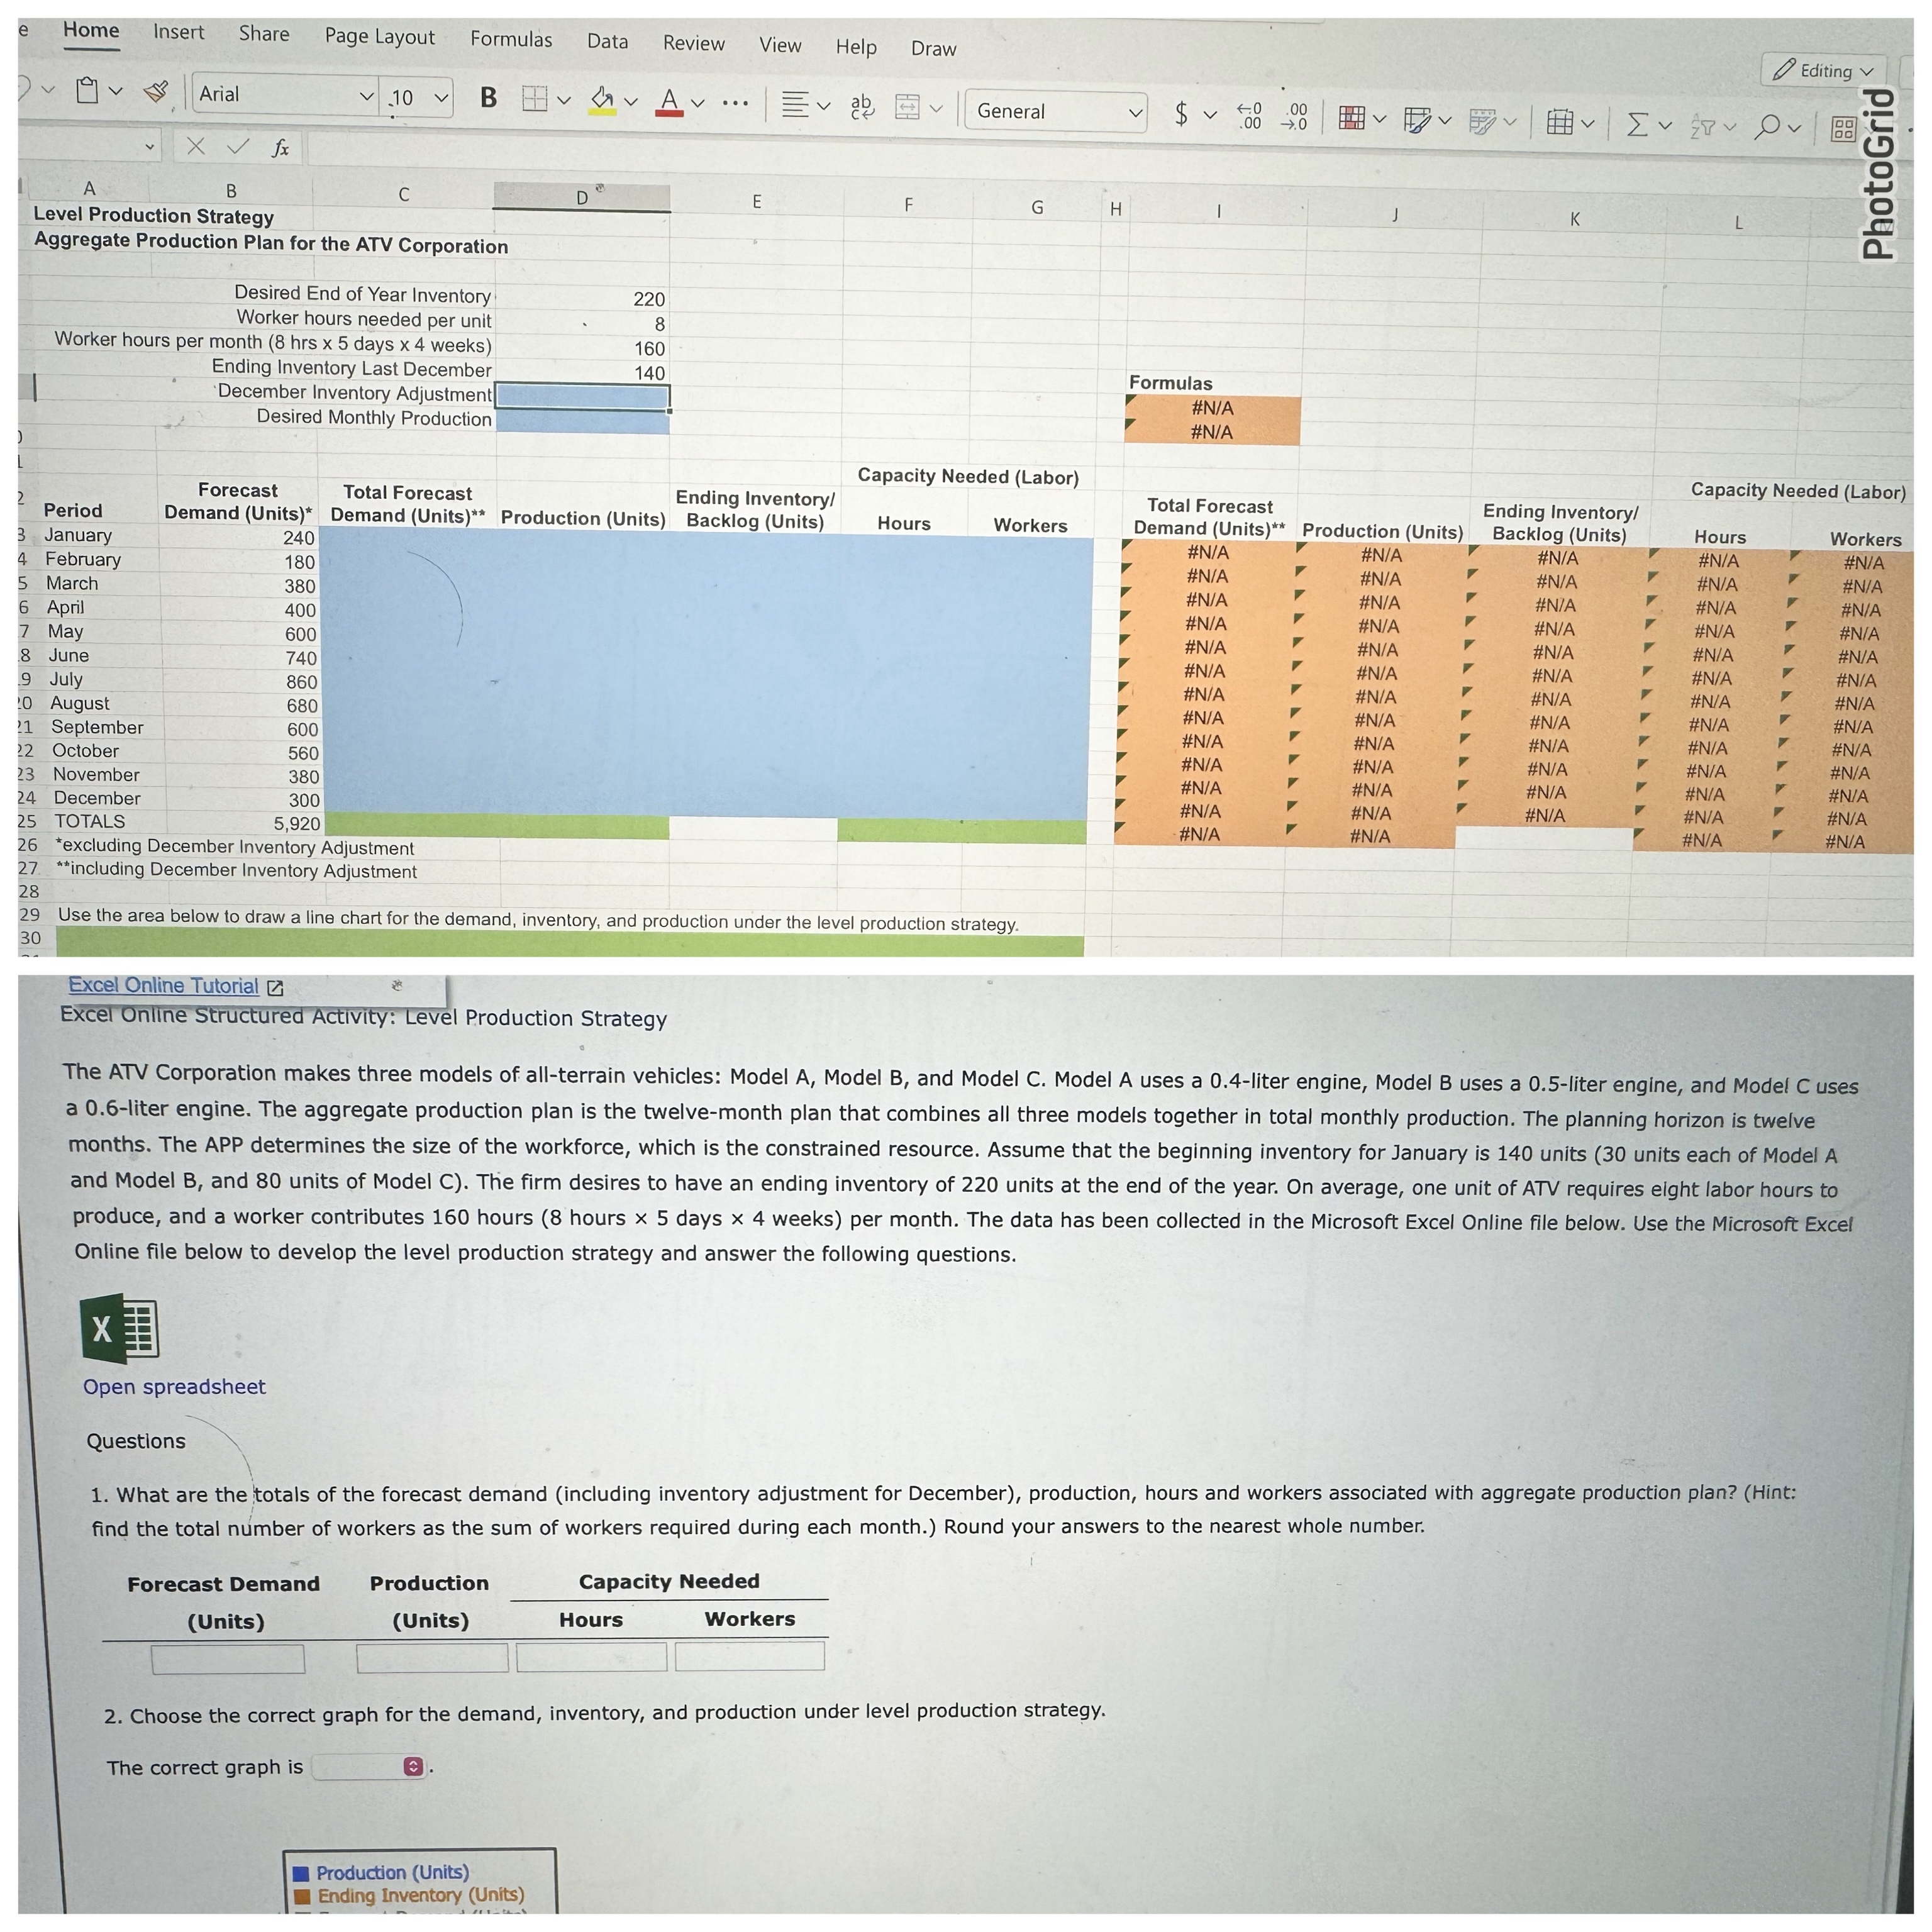
Excel Online Structured Activity: Level Production Strategy Online file below to develop the level production strategy and answer the following questions.
Open spreadsheet
Questions find the total number of workers as the sum of workers required during each month. Round your answers to the nearest whole number.
tabletableForecast DemandUnitstableProductionUnitsCapacity NeededHoursWorkers
Choose the correct graph for the demand, inventory, and production under level production strategy.
The correct graph is
Production Units
Ending Inventory Units
Step by Step Solution
There are 3 Steps involved in it
1 Expert Approved Answer
Step: 1 Unlock

Question Has Been Solved by an Expert!
Get step-by-step solutions from verified subject matter experts
Step: 2 Unlock
Step: 3 Unlock