

Question: excel please! also need the LCL x, UCL R, LCL R Refer to Table 56.1 - Factors for Computing Control Chart Limits.(3.ama) for this problem,
excel please! also need the LCL x, UCL R, LCL R 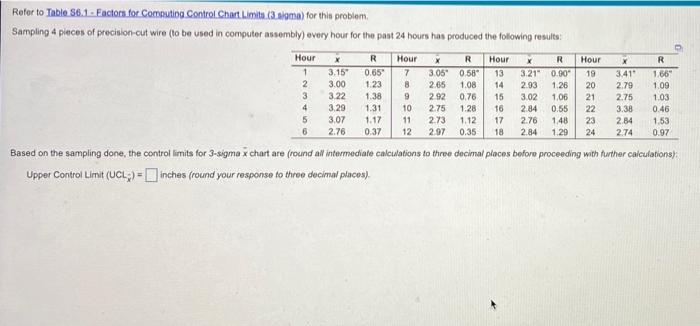
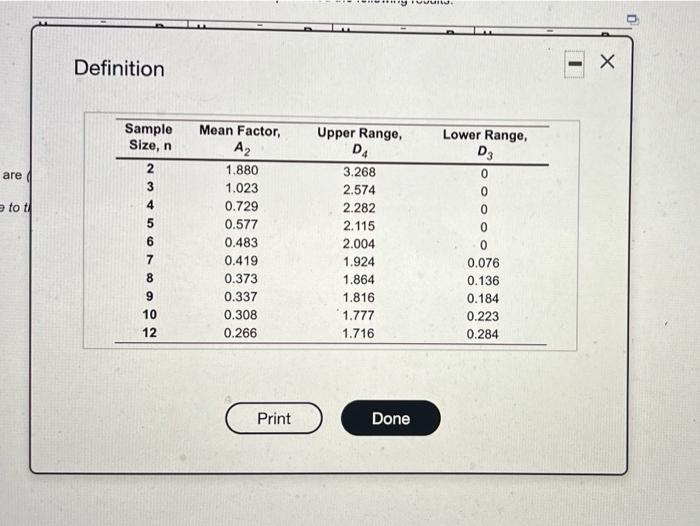
Refer to Table 56.1 - Factors for Computing Control Chart Limits.(3.ama) for this problem, Sampling 4 pieces of precision-cut wire (to be used in computer assembly) every hour for the past 24 hours hos produced the following results: Hour R R Hour 1 2 3 4 5 6 x 3.15 3.00 3.22 3.29 3.07 2.76 R 0.659 1.23 1.38 1.31 1.17 0.37 Hour 7 8 9 10 11 12 x R 3.05* 0.58 2.65 1.08 292 0.76 2.75 1.28 2.73 1.12 297 0.35 13 14 15 16 17 18 X 3.21" 0.80 2.93 1.26 302 1.06 2.84 0.55 2.76 1.48 2.84 Hour 19 20 21 22 3/41 2.79 2.75 3.38 2.84 2.74 1.66 1.09 1.03 0.46 1.53 0.97 1.29 24 Based on the sampling done, the control limits for 3-sigma x chart are (round all intermediate calculations to three decimal places before proceeding with further calculations), Upper Control Limit (UCL.2 - inches (round your response to three decimal puncos) HUVU Definition Lower Range, 03 are Sample Size, n 2 3 4 5 0 0 0 tot Mean Factor, A2 1.880 1.023 0.729 0.577 0.483 0.419 0.373 0.337 0.308 0.266 Upper Range, DA 3.268 2.574 2.282 2.115 2.004 1.924 1.864 1.816 1.777 1.716 7 8 9 10 12 0 0.076 0.136 0.184 0.223 0.284 Print Done
Step by Step Solution
There are 3 Steps involved in it
1 Expert Approved Answer
Step: 1 Unlock

Question Has Been Solved by an Expert!
Get step-by-step solutions from verified subject matter experts
Step: 2 Unlock
Step: 3 Unlock