

Question: Refer to Table S6.1-Factors for Computing Control Chart Limits (3 sigma) for this problem. Sampling 4 pieces of precision-cut wire (to be used in computer
Refer to Table S6.1-Factors for Computing Control Chart Limits (3 sigma) for this problem. Sampling 4 pieces of precision-cut wire (to be used in computer assembly) every hour for the past 24 hours has produced the following results: Hour 1 2 3 4 5 6 X 3.25" 3.10 3.22 3.29 3.17 2.76 R 0.65" 1.13 1.43 1.21 1.17 0.32 X X Hour R Hour R Hour 7 3.05" 0.48" 13 3.01 0.90" 19 8 2.65 1.13 14 2.93 1.36 20 9 3.12 0.76 15 3.02 1.11 21 10 2.75 1.38 16 2.94 0.55 22 11 2.93 1.17 17 2.76 1.38 23 12 2.87 0.35 18 2.74 1.24 24 3.31" 2.89 2.65 3.38 2.94 2.74 R 1.66" 1.04 1.08 0.46 1.53 1.02 D Based on the sampling done, the control limits for 3-sigma x chart are (round all intermediate calculations to three decimal places before proceeding with further calculations): Upper Control Limit (UCL) - inches (round your response to three decimal places). =
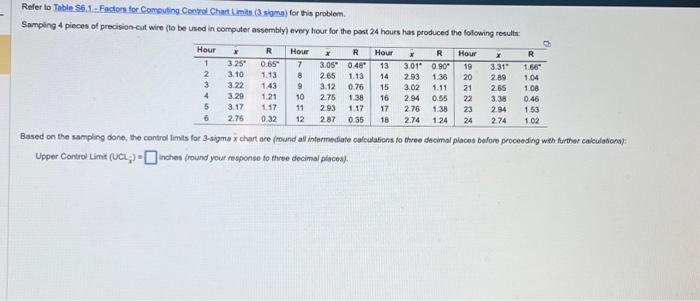
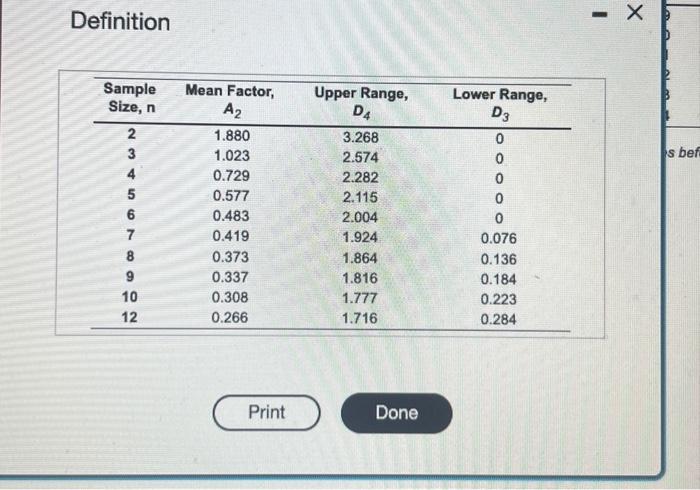
Refer to Table S6.1. Facton for Comouling Control Chart Limils (3 siome) for this problem. Samping 4 pieces of precision-cut wire (to be used in computer assembly) every hour for the past 24 hours has produced the folowing resultr: Based on the sampling done, the control limits for 3-sigma x chart are (round all infermediate calculabions to three decimal places before proceeding weh further calculabons): Upper Control Limit (UCLz)= inches (round your msponse to three decimal places). Definition
Step by Step Solution
There are 3 Steps involved in it
1 Expert Approved Answer
Step: 1 Unlock

Question Has Been Solved by an Expert!
Get step-by-step solutions from verified subject matter experts
Step: 2 Unlock
Step: 3 Unlock